
Figure 2.


Figures 2a–d. Mean ERG responses from all children in the longitudinal vigabatrin study who received ERGs less than 18 months after initiation of vigabatrin. Log relative amplitudes are plotted against length of time on vigabatrin (months). Black lines represent data on vigabatrin treatment only, gray lines are data from children on vigabatrin treatment and additional anticonvulsive treatment. The error bars represent the standard deviation (mean of four visits). Shaded areas represent lab normal ranges containing 95% of control data. (a) Rod b-wave amplitude; (b) Mixed rod–cone a-wave amplitude; (c) Mixed rode–cone b-wave amplitude; (d) Scotopic sum of OPs.
Figures 2e–h. (e) cone a-wave amplitude responses, (f) cone b-wave amplitude responses (g) flicker amplitude data (h) photopic sum of OPs.
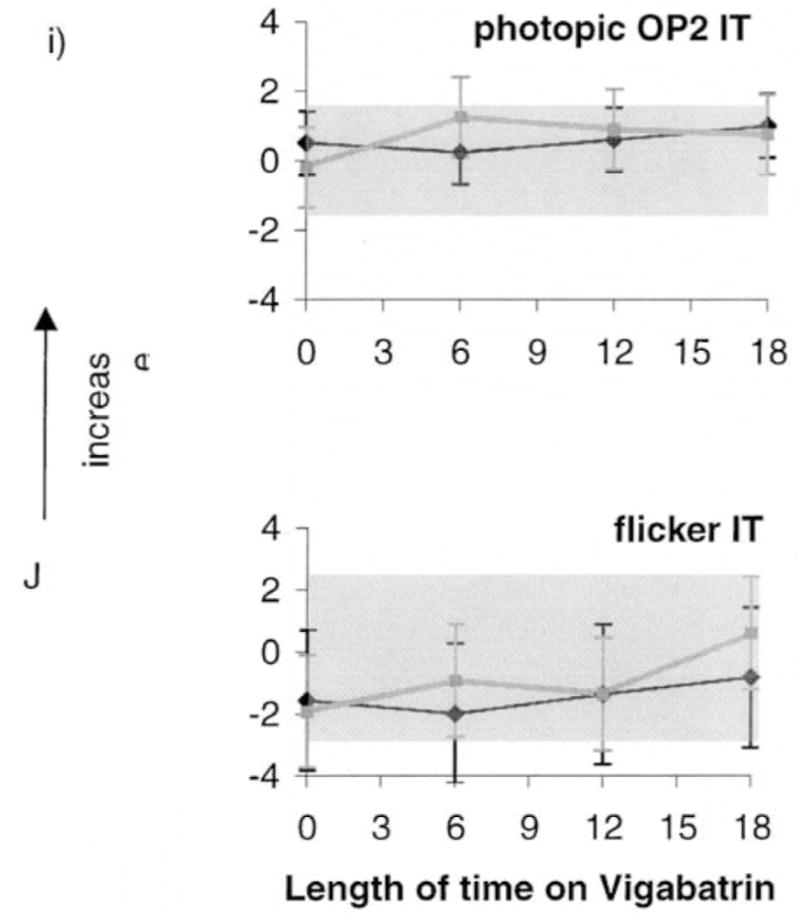
Figures 2i–j. (i) photopic OP2 implicit time, (j) flicker implicit time from all children in the longitudinal study. Vertical arrows signify that the upward direction reflects increase in both amplitude and implicit time data.