
Figure 2.
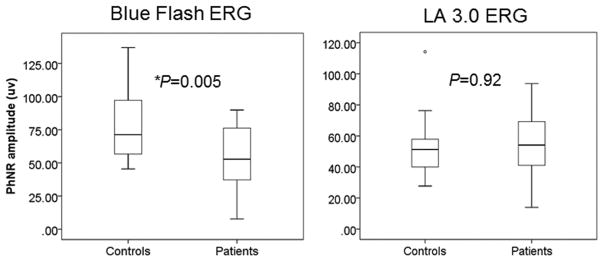
Between-group comparisons of the PhNR amplitude in the blue flash ERG and LA 3.0 ERG (*P < 0.05). Boxes represent the 25th and 75th percentiles, the line represents the median. Whiskers represent 1.5 interquartile range (IQR), circles are data beyond the 1.5 IQR.