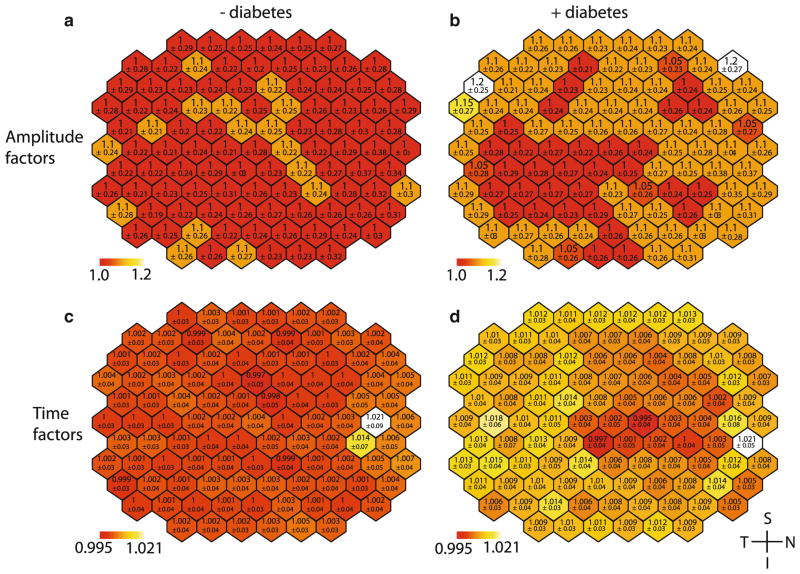
Fig. 2.
Spatial distribution of mean stretch factors across mfERG. Top a, b amplitude stretch factors, bottom c, d time stretch factors. Left column a, c control data, right column b, d subject data. All images are shown in right eye orientation. Lower values represent 1 standard deviation. Colour scales are consistent across results. The red end of the scale represents the minimum mean hexagon value for controls and subjects. Values towards the white end of the scale represent the maximum mean hexagon value. The colour scale is separated into 50 equal-sized divisions spanning the entire range

