Fig. 3.

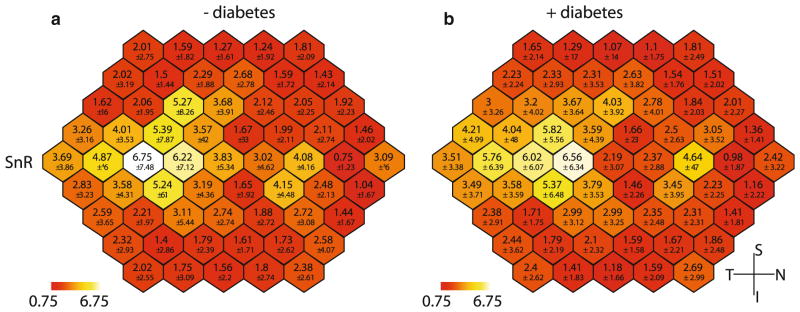
Spatial distribution of mean SNR values from sf-mfERG recordings. a Mean of control data, b mean of subject data. All images are shown in right eye orientation. Lower values represent 1 standard deviation

Spatial distribution of mean SNR values from sf-mfERG recordings. a Mean of control data, b mean of subject data. All images are shown in right eye orientation. Lower values represent 1 standard deviation