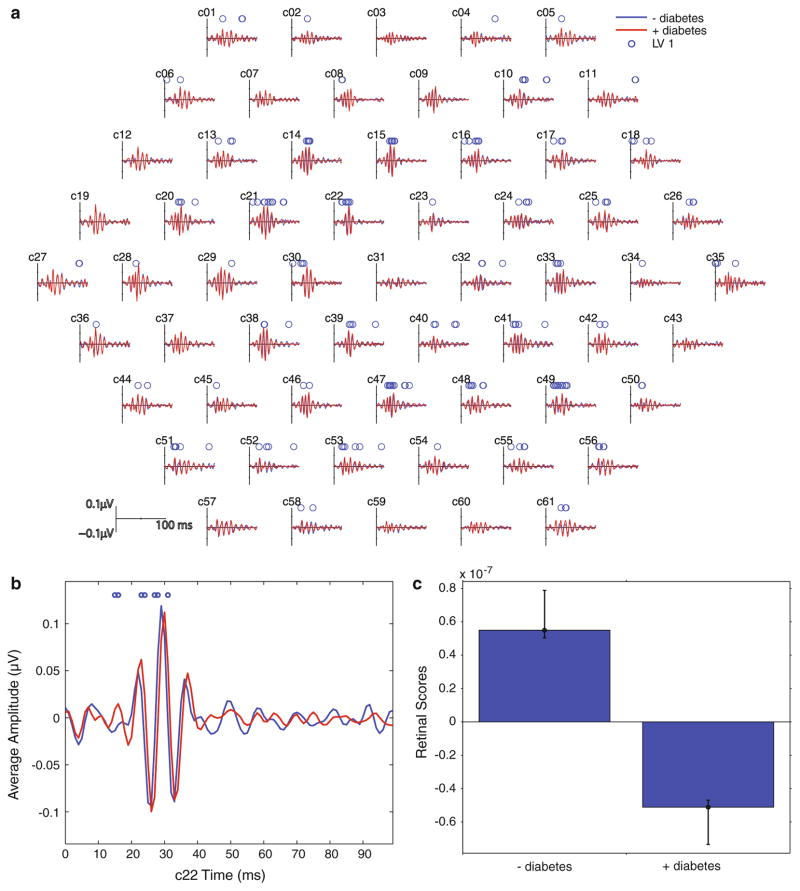
Fig. 5.
a Group average slow-flash mfERG waveforms. b Close-up of one retinal area (c22). Red lines are the average waveform from subjects with diabetes, and blue lines are the average from control subjects. Circles above the waveforms indicate time points that are significantly different between groups. c Retinal response scores for LV1 associated with the 2 groups. Whiskers indicate the confidence bars. The upper and lower bounds for the 95 % confidence interval are the computed percentiles of the bootstrapped distribution

