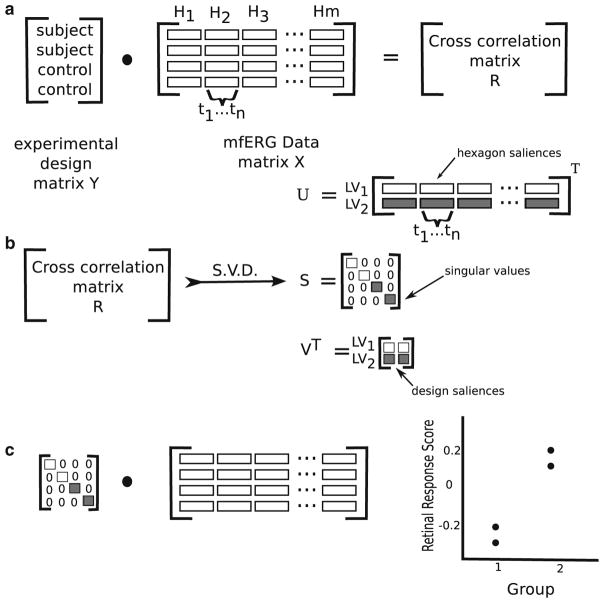
Fig. 6.
Diagram illustrating the steps in the ST-PLS analysis of mfERG data. a The cross-correlation between the experimental design (diabetes/no diabetes) and the mfERG recordings (Hn hexagon, tn time point). b The singular value decomposition (SVD) of the cross-correlation matrix (LV latent variable). c Multiplication of the mfERG data matrix with the singular values from the SVD to obtain the retinal response scores. Figure adapted by the author from [5]

