
FIGURE 2.
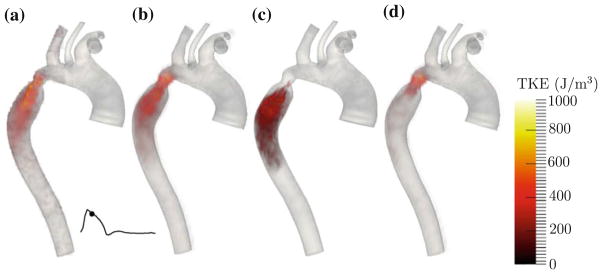
Fluctuation intensity fields for each method (0.17 s after the start of systole). Note that the mesh type and resolution for the volume render of the temporal fluctuation intensity field were different than for the rest of the renders: (a) PCMRI, (b) spatiotemporal, (c) temporal, and (d) spatial.