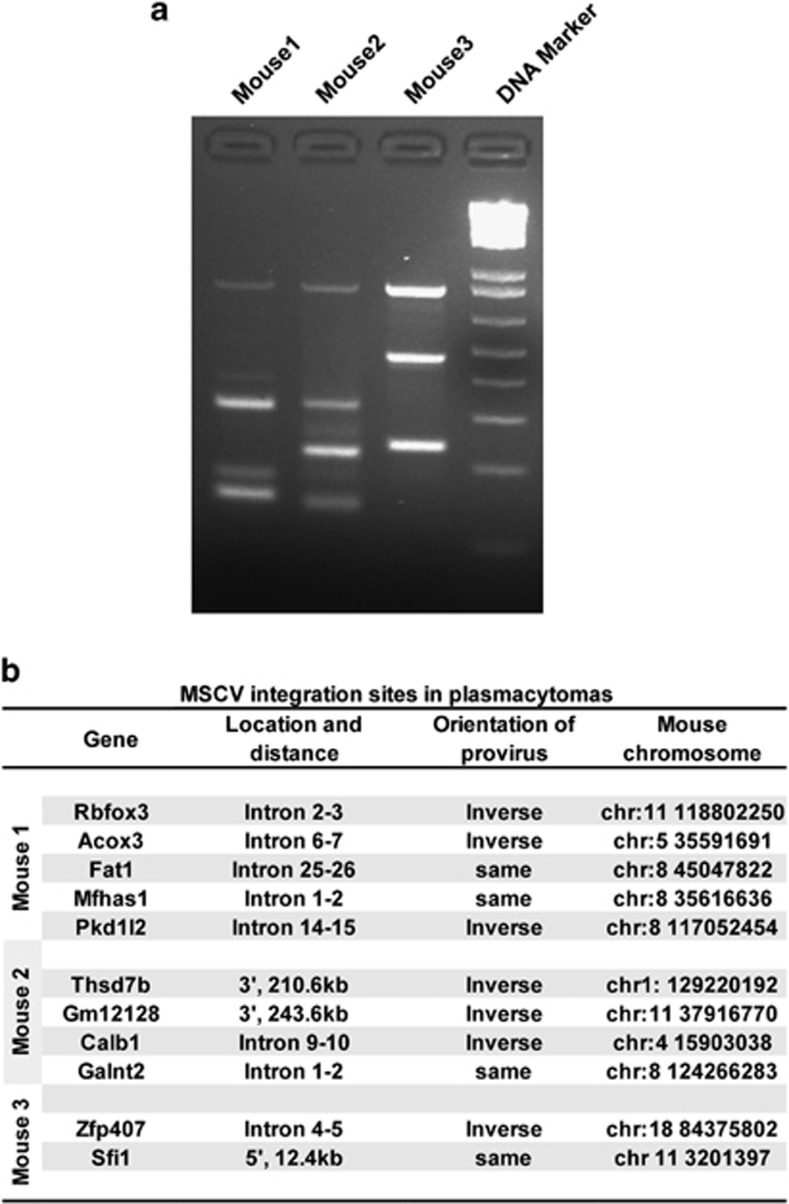
Figure 8.
Provirus integration sites. (a)The splinkerette-PCR results of provirus integration sites. The lanes of 3% agarose gel showed the splinkerette-PCR production for three mouse plasmacytoma samples with 100 bp marker. Each band represents a provirus integration site and a tumor cell subclone, except for the top band, which represents retroviral vector endogenous fragment (617 bp, not including the linker sequence). (b) Identification of MSCV integration sites in plasmacytoma cells.

