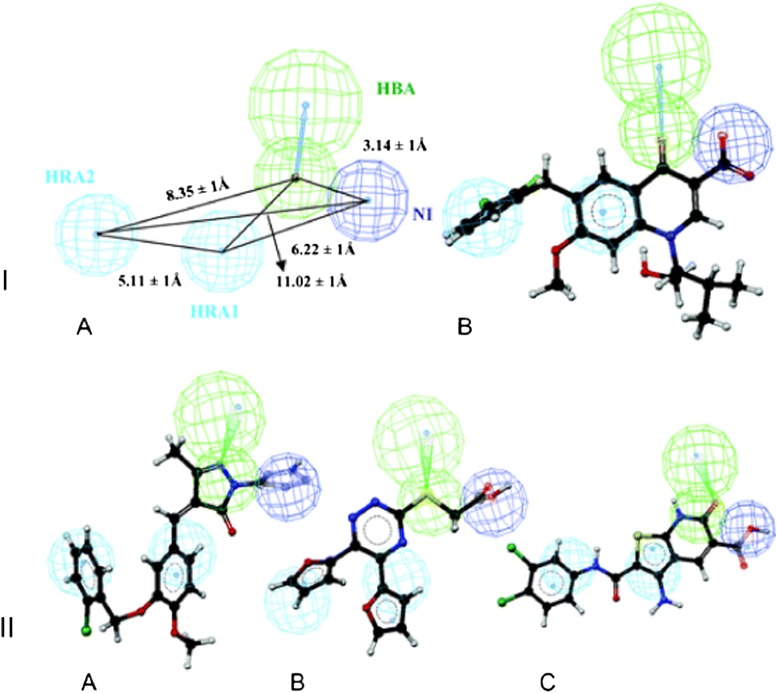
Fig. 18.
(I, A) Novel HIV-1 Integrase inhibitor using ligand-based virtual screening with a pharmacophore model of quinolone 3-carboxylic acid IN inhibitors [from Dayam et al. (2008)]. (B) Pharmacophore query generated from the quinolone 3-carboxylic acid IN inhibitors accompanied with an overlay onto a known HIV-1 integrase inhibitor. Features are color-coded, and their 3D arrangement/distances are shown in angstroms. Green sphere represent H-bond acceptor regions, blue spheres represent negatively ionizable regions, and cyan spheres represent hydrophobic aromatic regions. (II) Pharmacophore query overlayed with 3 potent hits from the ligand-based virtual screen: compounds 8 (A), 9 (B), and 17 (C).

