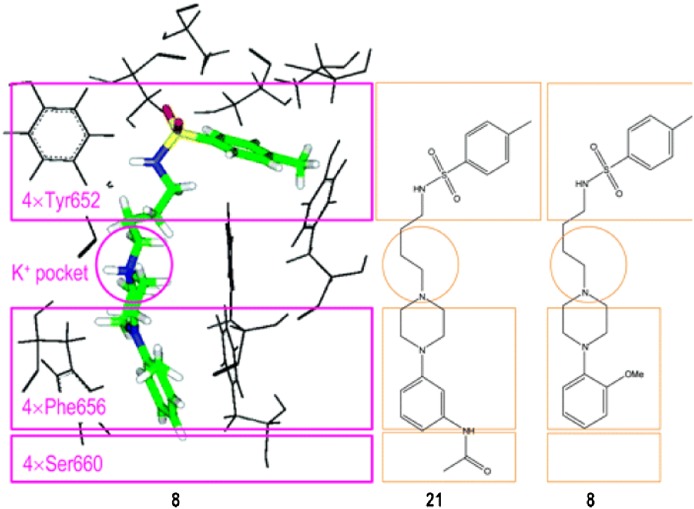
Fig. 9.
A comparison of the hERG binding modes of compounds 8 and 20d. Shown are a detailed 3D view of the binding of compounds 8 in the hERG pore, as well as two schematic views of the binding of compounds 8 and 20d next to each other. The four main interaction regions are highlighted in all views: an aromatic region formed by the four Tyr652 residues, a K+ pocket, an aromatic region formed by the four Phe656 residues, and a polar region formed by four Ser660 residues (shown only schematically).

