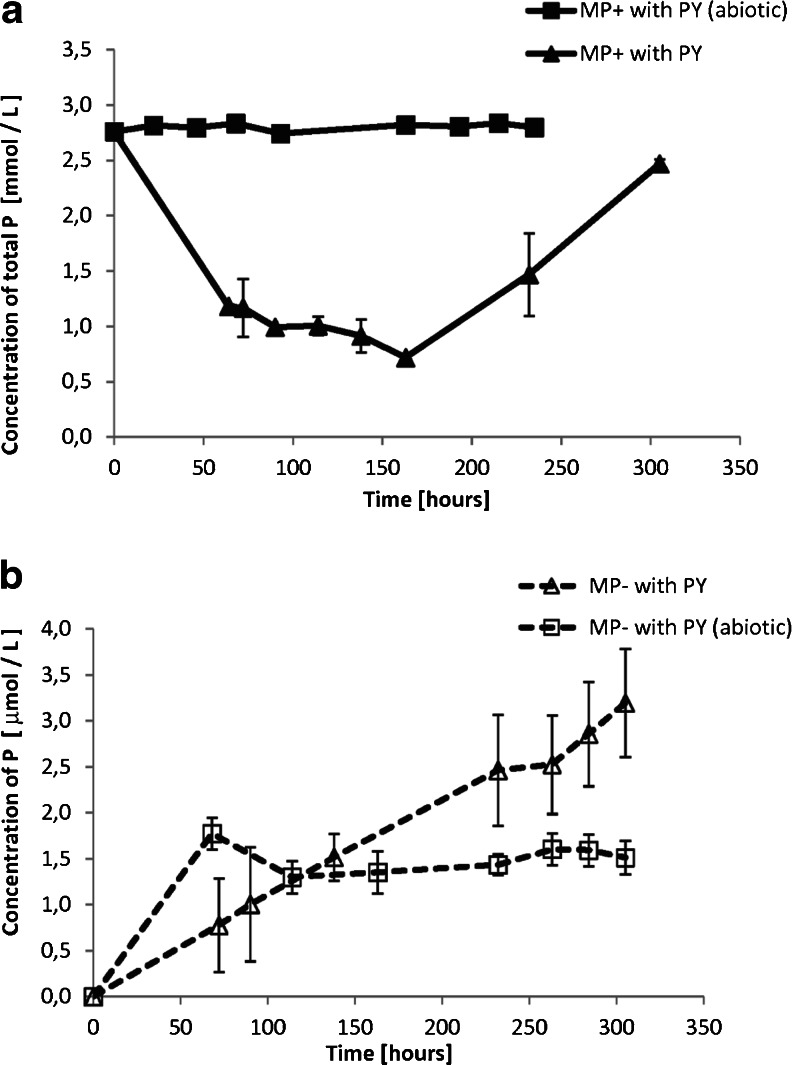
Fig. 5.
Total concentration of P in the experimental reactors from the E.II series as a function of time. Error bars represent the standard deviation of triplicate. a P-rich solution. A fluctuation of P concentration in this suspension resembles the inversion of the culture growth cycle; b P-deficient solution. The P concentration in the solution inoculated with bacteria constantly increased with time and was significantly higher than in the corresponding abiotic experiment. Note the scale difference

