Table 64.
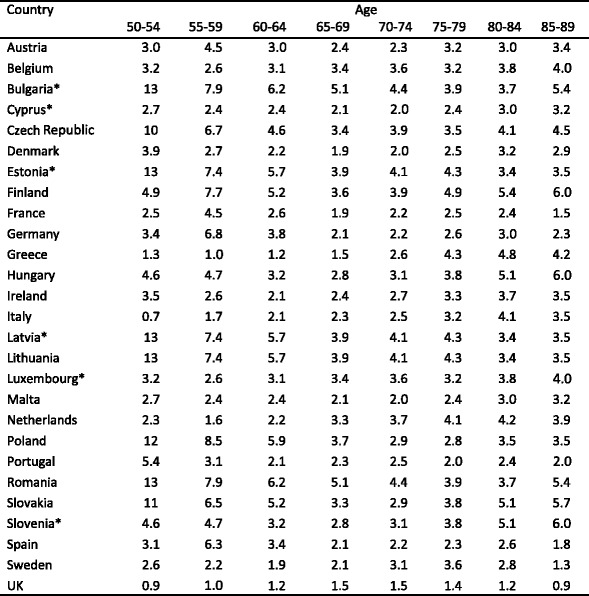
The proportion (%) of the male population in each age category at or above a probability based fracture threshold

*surrogate country used
The proportion (%) of the male population in each age category at or above a probability based fracture threshold

*surrogate country used