
Table 25.
Information available on hip fracture incidence and EU standardized (2010) hip fracture rates (per 100,000 per year)
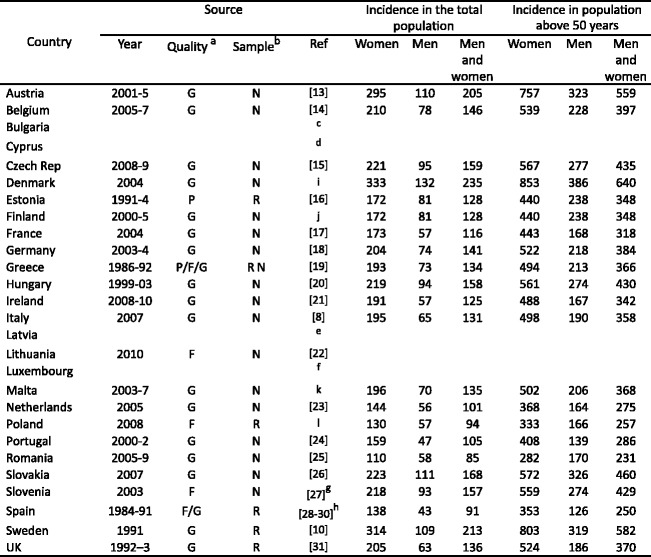
a Quality: G good; F fair; P poor [9], b Catchment: N national; R regional, c Data not available and incidence from Poland used as a surrogate ., d Data not available and incidence from Greece used. e Data not available and incidence from Finland used. f Data not available and incidence from Belgium used. g Data only available for female population, h Mean value of five regions described in three studies, i Abrahamsen, B., personal communication, 2011; j Kroger, H and Sund R., personal communication, 2011; k Schrembi, A., personal communication, 2011; l Czerwinski, E. and Lorenc, R., personal communication, 2011.