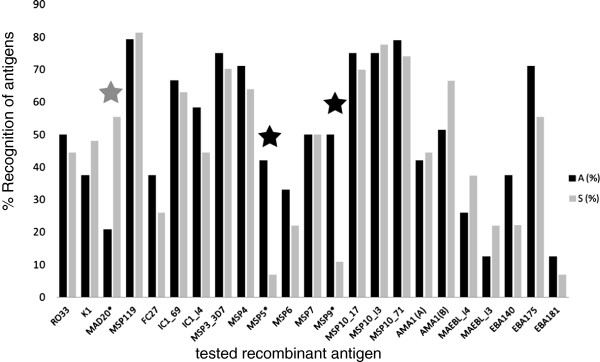
Figure 3.

Percentage of recognition of different proteins by plasmas from asymptomatic (“A”) and symptomatic patients (“S”) from the same area. The tested antigens are shown on the x-axis while the percentages of plasmas with positive recognition (RI > 1) per clinical group are shown on the y-axis. The reactivity index RI was calculated by dividing OD values from sample plasmas against given antigens by the a media plus 2 standard deviations of OD values obtained with the same antigens recognized by 13 malaria-naïve subjects (see also Methods). Statistical differences are indicated as asterisks and were found for the MAD20-type sequence of MSP1 block 2: S > A (p = 0.0206), MSP5: A > S (p = 0.0069) and MSP9: A > S (p = 0.0047).
