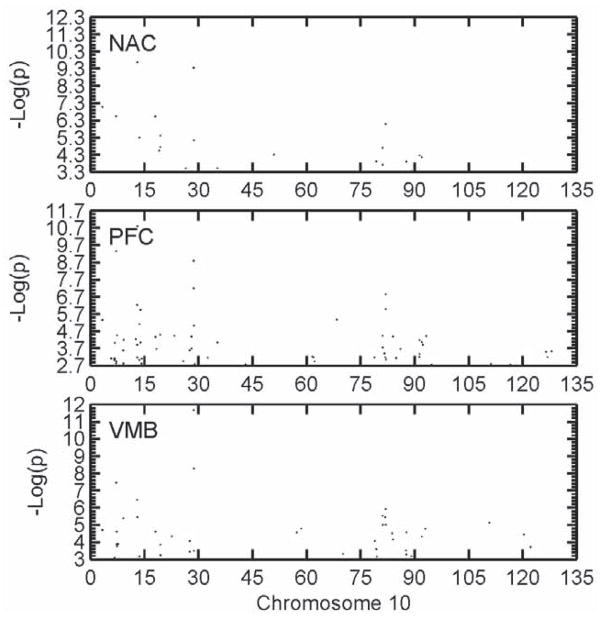
Figure 4.
The distribution of differentially expressed (DE) probe sets on Chr 10 between the MAHDR and MALDR lines that attained FDR < 0.05 for each of the three brain areas, either nucleus accumbens (NAC), prefrontal cortex (PFC) or ventral midbrain (VMB). As can be seen, the clustering of DE probe sets in particular chromosomal locations was closely similar for all three brain areas although the probe sets making up each cluster often did not agree. The QTL influencing the MADR trait was on proximal Chr 10, with a 2-LOD support interval ranging from 10 to 40 Mb; however, the lack of markers at the most proximal end (centromere) impacts the ability to exclude this region. The X axis in all cases was the negative logarithm of the p value for the line difference.

