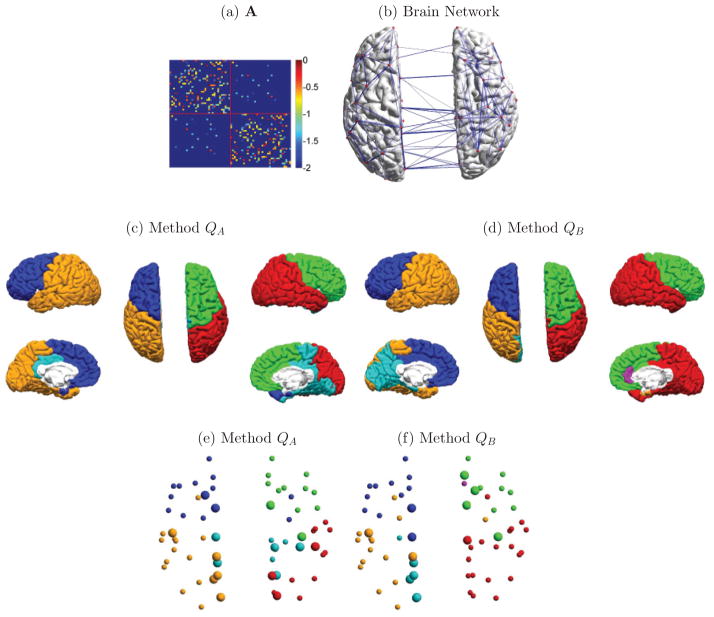
FIG. 11.
Graph analysis of a structural network based on diffusion brain imaging. (a) Adjacency matrix with the upper-left and lower-right quadrants corresponding to regions of interest on the right and left hemispheres, respectively; (b) structural brain network with edges greater than 0.1; (c) partition results for method QA. Color indicates cluster membership; (d) same as before for method QB; (e) partition results for method QA, but now spheres indicate ROIs and larger spheres indicate network hubs; (f) same as before for method QB.

