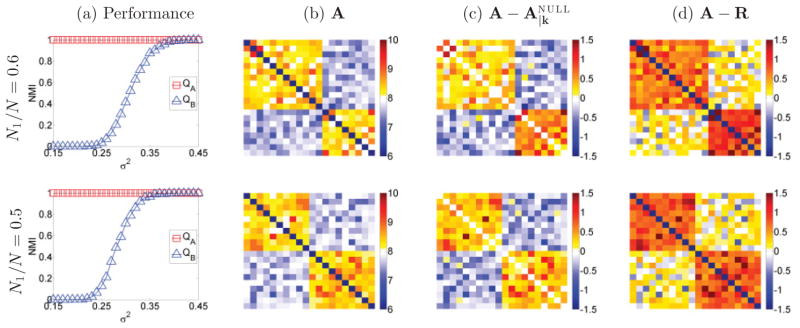
FIG. 3.

Partition results for Gaussian graphs. (a) Performance against different values of variance (σ2) of the Gaussian distribution and zero additive noise ( ); (b) adjacency matrix; (c) difference between adjacency matrix of original graph versus null model ; (d) same for R null model. Top row: 12 vs 8 cluster size; bottom row: 10 vs 10 cluster size. Method QA accurately partitions the graph for all values of σ2, whereas method QB fails for low values of σ2.
