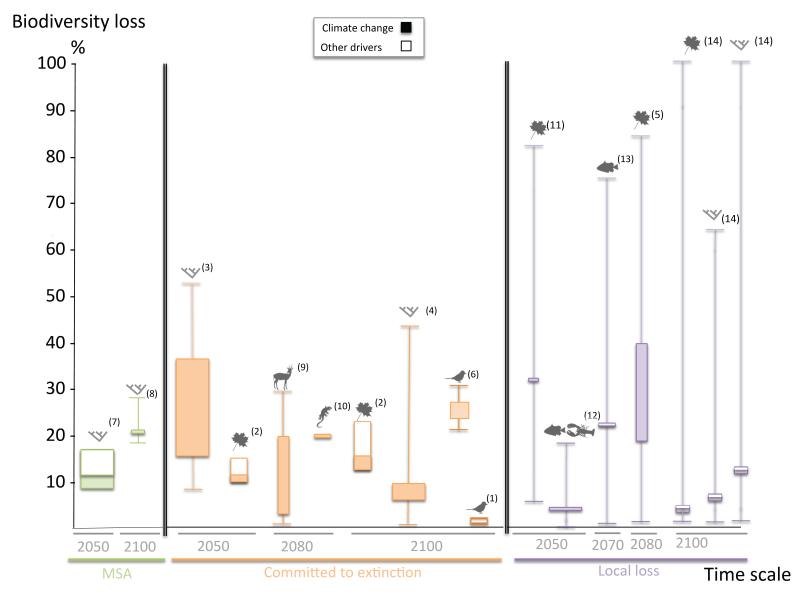
Figure 4.
Projections of loss of biodiversity due to climate change, for different taxonomic, temporal and spatial scales. The width of the box illustrates three levels of generality: global scale and several taxonomic groups ( ), global scale and only one taxonomic group, continental scale and only one taxonomic group. The box is delimited by the upper and lower boundaries of the intermediate scenario, while maximum and minimum values of the whiskers indicate the highest and lowest biodiversity losses across all projections. This figure illustrates that the different studies (i) generally predict significant biodiversity loss and (ii) use a combination of different biodiversity metrics, taxonomic groups and spatial scale and time horizon, making generalisations difficult. Numbers correspond to references (see Appendix S2 for details and references).

