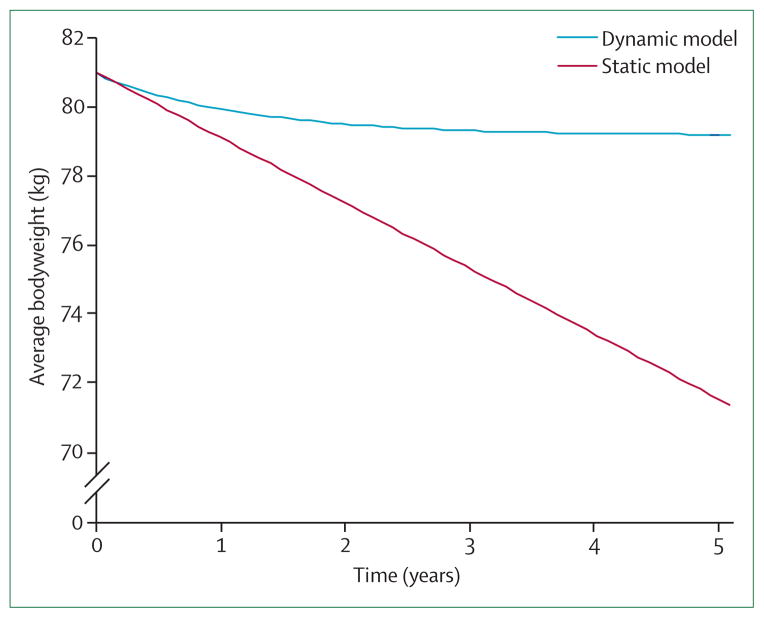
Figure 6. Prediction of the effect of a policy intervention on the population average weight.
Simulated average weight change of a 20% tax on caloric sweetened beverages. The average energy-intake change was specified in a recent report by the US Department of Agriculture (USDA)12 and initial population average weight of 81 kg corresponded to the most recent measurement in the USA. Rather than produce the progressive weight loss predicted by the static model, the same decrease of energy intake led to a simulated modest weight-loss plateau.

