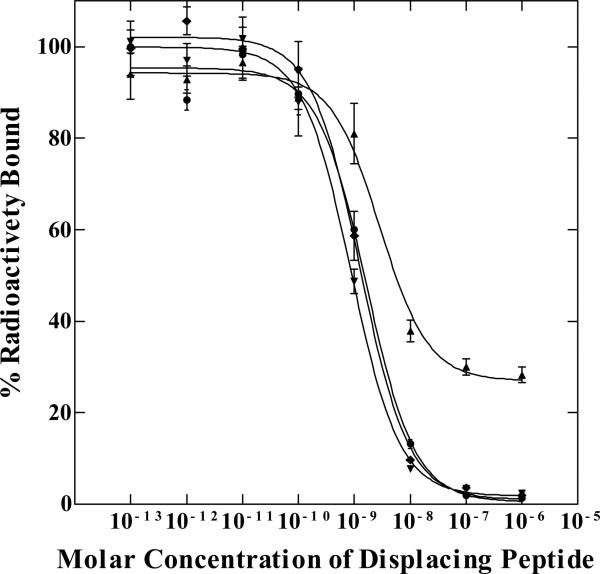
Figure 2.
The competitive binding curves of RSD-Lys-(Arg11)CCMSH (●), RNleD-Lys-(Arg11)CCMSH (▲), RFD-Lys-(Arg11)CCMSH (■), and RfD-Lys-(Arg11)CCMSH (◆) in B16/F1 murine melanoma cells. The IC50 value was 1.30 ± 0.36 nM for RSD-Lys-(Arg11)CCMSH, 2.99 ± 0.26 nM for RNleD-Lys-(Arg11)CCMSH, 0.82 ± 0.06 nM for RFD-Lys-(Arg11)CCMSH, and 1.35 ± 0.08 nM for RfD-Lys-(Arg11)CCMSH, respectively.

