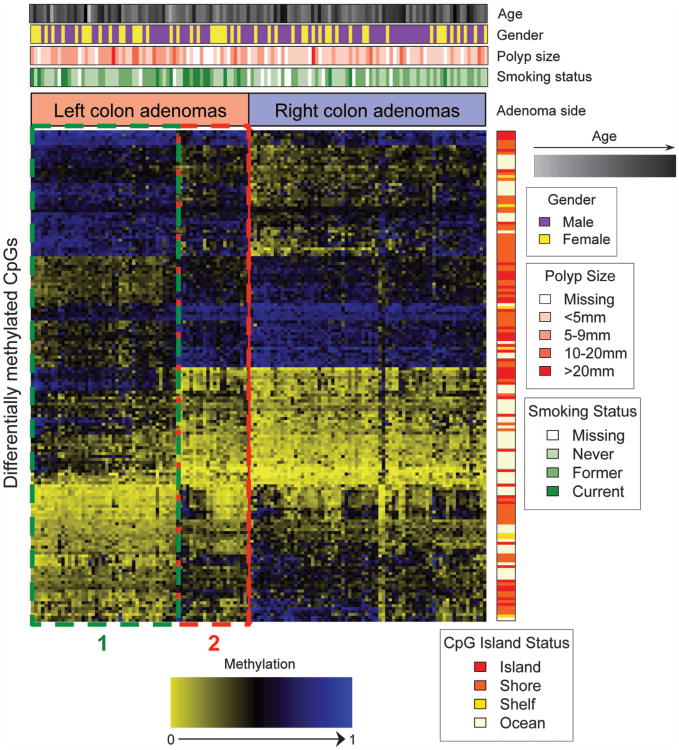
Figure 4.
Heat map of the 168 significantly differentially methylated CpG loci between right- and left-colon adenomas. Methylation values are presented as unmethylated (yellow) to methylated (blue). Rows are represented by the 168 differentially methylated loci and columns represent subjects who are grouped based on adenoma side. On the right-hand side of the heat map is a color side bar, which indicates the island status for the 168 CpG loci. Above the heat map are color side bars that indicate smoking status, polyp size, gender, and age for the study subjects. Red and green dotted boxes indicate two subgroups of left-colon adenoma subjects, referred to as subgroups 1 and 2.

