Figure 5.
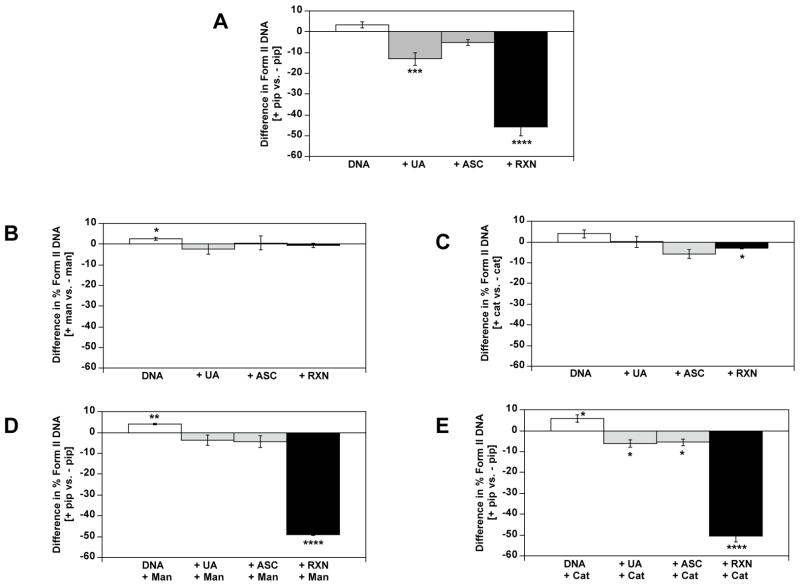
Effect of mannitol and catalase on % DNA plasmid relaxation (Form II) in the absence and presence of piperidine. pBR322 DNA was reacted with UA and ascorbate as described in Figure 4. (A) For comparison purposes, the reactions from Figure 4B are shown as difference in % Form II DNA for [piperidine vs. no piperidine]. Reactions were also carried out in the added presence of: (B) 500 μM mannitol, followed by addition of water or 30 μM piperidine and incubation for 30 min at 60 °C. (C) 70 U/mL catalase, followed by addition of water and incubation for 30 min at 60 °C. (D) 500 μM mannitol, followed by addition of 30 μM piperidine and incubation for 30 min at 60 °C. (E) 70 U/mL catalase, followed by addition of 30 μM piperidine and incubation for 30 min at 60 °C. In all cases data represent mean ± SEM for differences in % Form II for [treatment vs. no treatment], for n = 5 independent experiments. Differences were significantly different than 0 by Student’s t-test (*p<0.05, **p<0.01, ****p<0.0001).

