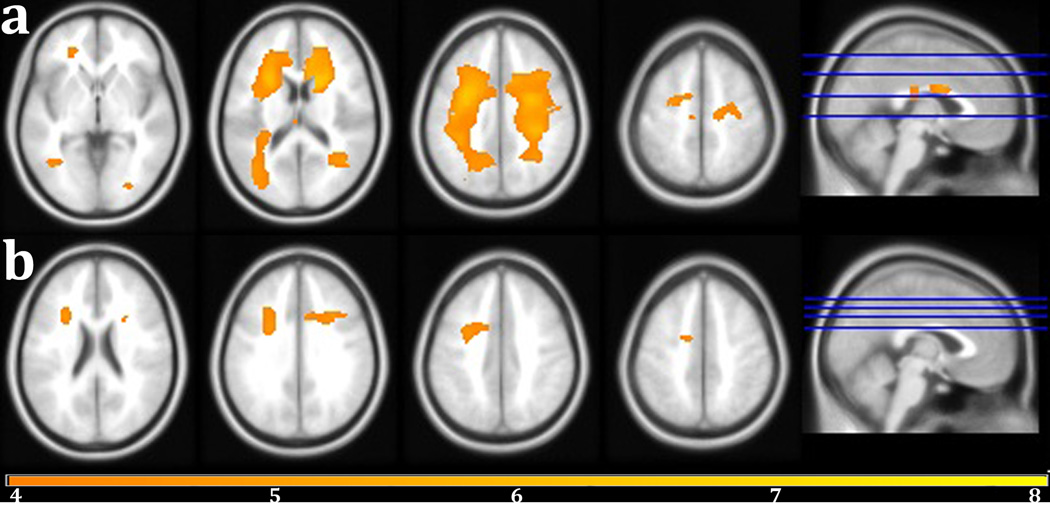
Figure 4.
(a)Areas of negative correlation with Speed and Flexibility factor score controlling for sex, intracranial volume, and years of education are shown in warm colors (yellow-orange). (b) Areas of negative correlation with Speed and Flexibility factor score controlling for age, sex, years of education, and ICV. FWE-correction, p < 0.05. The color bar indicates the t-value. Peak voxel coordinates, t-value, p-value, and cluster size are listed in Table 2.

