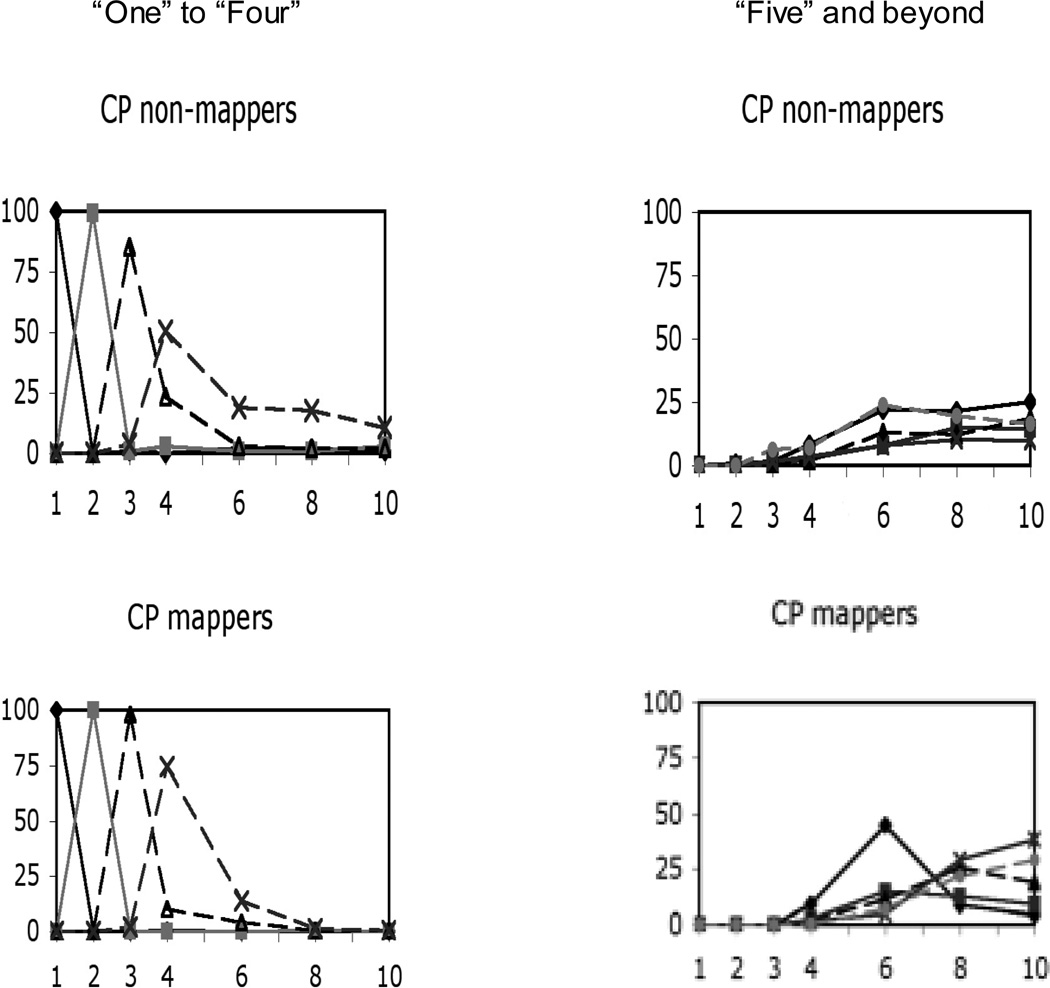
Figure 4.
Numeral distributions for CP non-mappers and CP mappers. Each distribution represents the probability of using a given numeral as a function of set size. For example, for sets of 1 object, the distribution for “one” shows how often children applied “one” to this set size out of all trials with this set size. Figures in the left column show the distributions for “one” to “four” (“one”:  ; “two”:
  ; “three”:
  ; “four”:
  ). Figures in the right column show the distributions for “five” (
 ), “six” (
 ), “seven” and “eight” (
 ); “nine” and “ten” (
 ); and all numerals beyond “ten” (
 ). The distributions for “seven” and “eight” were added together to simplify the figures as were the distributions for “nine” and “ten” and the distributions for numerals greater than “ten”.

