
Fig. 18.
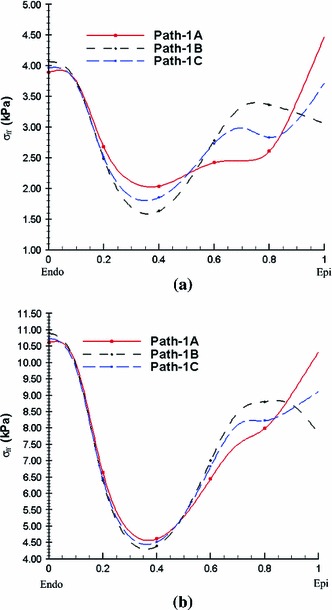
The transmural fibre stress distribution at an endocardial pressure load of  mmHg (a) and
  mmHg (b). Here, A is the curve with residual stress estimated from the anisotropic model, B is without the residual stress, and C is with the isotropic model. In all computations, the simpler approach is used