
Figure 3.
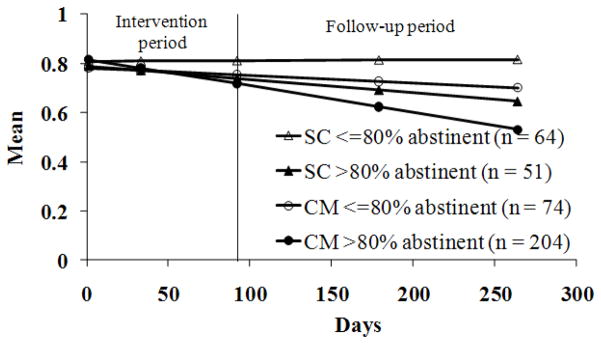
Brief Symptom Inventory Global Symptom Index scores over time by treatment condition and proportion of negative samples submitted. Data are derived from hierarchical linear models analyses as described in the text, and represent group means. Data from patients assigned to the standard care (SC) condition are shown in triangles, and data from patients assigned to a contingency management (CM) condition are shown in circles. Groups are further subdivided based upon proportion of negative samples submitted; patients who submitted less than 80% negative samples are shown in open symbols, and patients who submitted more than 80% negative samples are shown in filled symbols.