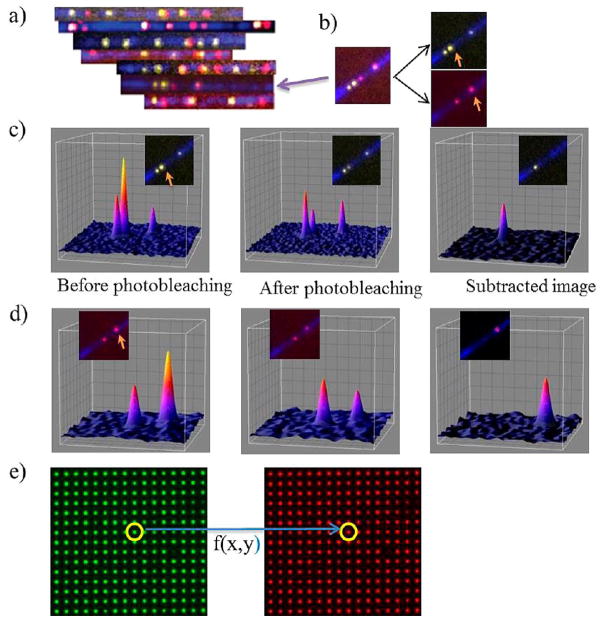
Figure 4.
Two-color super-resolution imaging of DNA molecules. (a) Diffraction limited imaging of BAC DNA fragments. DNA backbone is shown in blue (YOYO-1 staining). Nb.BsmI nicking sites are in yellow and Nb.BbvCI sites are in red. DNA fragments are rotated to be aligned with all others based on the nicking pattern. (b) Image of a single DNA fragment (the fragment on panel a shown with an arrow). The image on the left is the superposition of the green and red images on the right. Excitations in the green and red channels are done alternatively. Arrows show SHRImP spots in each channel. (c) Gaussian profiles of spots in the green channel on the DNA fragment. Colors in the profiles shows varying intensities (blue to yellow is low to high intensities). The graph includes Gaussian profiles of the SHRImP spot (shown with arrow) before and after photobleaching (first and second graph). Third graph is the Gaussian profile of the second dye on the SHRImP spot. It is found by subtracting spot’s intensity profile after photobleaching from that of before photobleaching (d) Gaussian profiles of dyes on the red channel on the same DNA fragment. Spot shown with arrow is a SHRImP spot. Gaussian profiles of the spot with before and after photobleaching are shown in first two graphs. Third one is Gaussian profile of the second dye on the SHRImP spot. (e) Fiduciary markers, which are 100 nm in diameter and 1.5 μm apart from each other, are used to map the green channel onto red channel to perform SHREC analysis. Alternating images of the fiduciary marker are taken in green and red channels. Then, a mapping matrix is produced by localization of every spot on the illumination area according to the algorithm in Goshtasby et al.12,13

