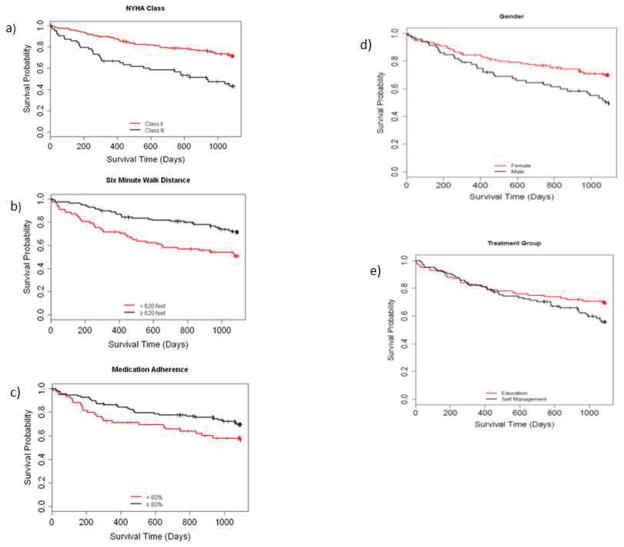
Figure 1.
Kaplan-Maier curves for the five independent predictors of death or heart failure hospitalization in patients with HFpEF. Unadjusted log-rank p-values for subgroup differences in time to primary event over the study duration are: NYHA Class, p < 0.0001; Six-Minute Walk distance, p = 0.002; Medication Adherence, p = 0.05; Gender, p = 0.006 and treatment group, p = 0.13.

