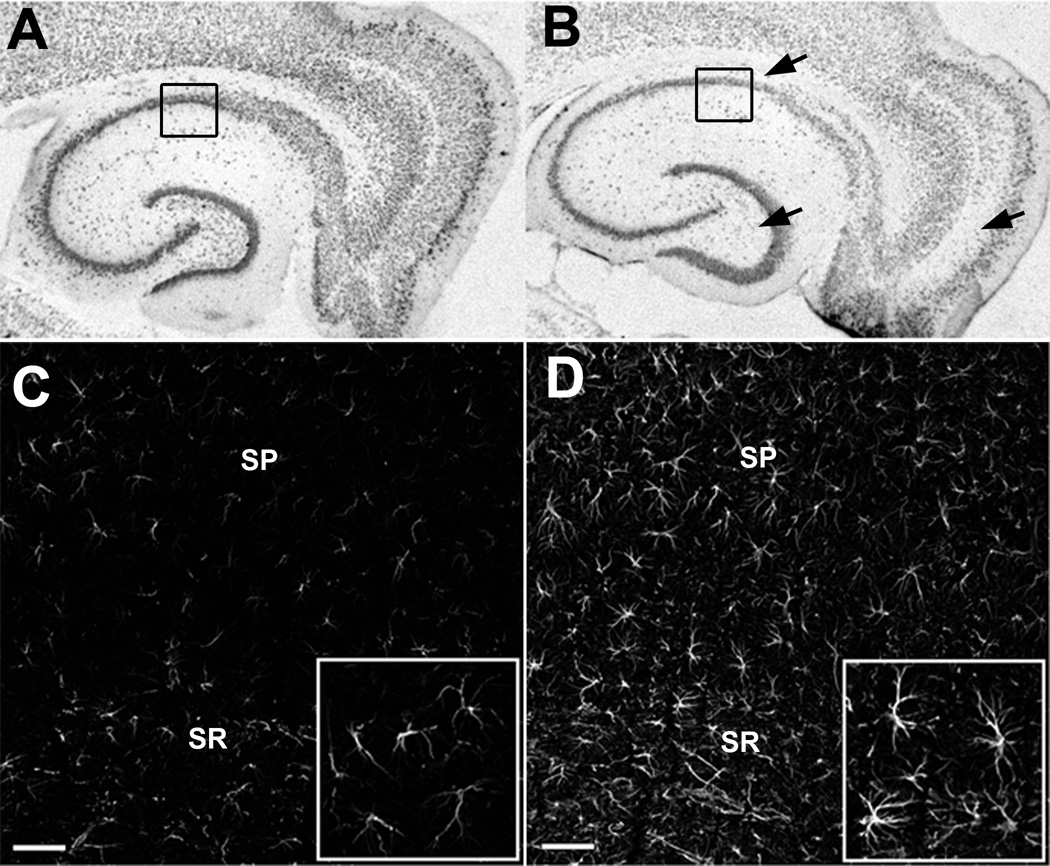
Figure 1.
Neuron loss and reactive astrocytes in the hippocampus following kainic acid (KA)-induced status epilepticus (SE). (A, B) Brightfield images of immunostaining for the neuronal marker NeuN in an age-matched control animal (A) and 1 week following KA-induced SE (B). Prominent cell loss and disruption of cell layers are indicated by black arrows. (C, D) Optical sections (1 µm thick) of immunofluorescence staining for GFAP in the CA1 region of age-matched control (C) and increased GFAP expression in astrocytes of the CA1 region following KA-induced SE (D). Black boxes in (A) and (B) indicate regional location of images in (C) and (D). Inset = increased magnification of selected regions in (C) and (D). SP = stratum pyramidale, SR= stratum radiatum, Scale bar = 50 µm.

