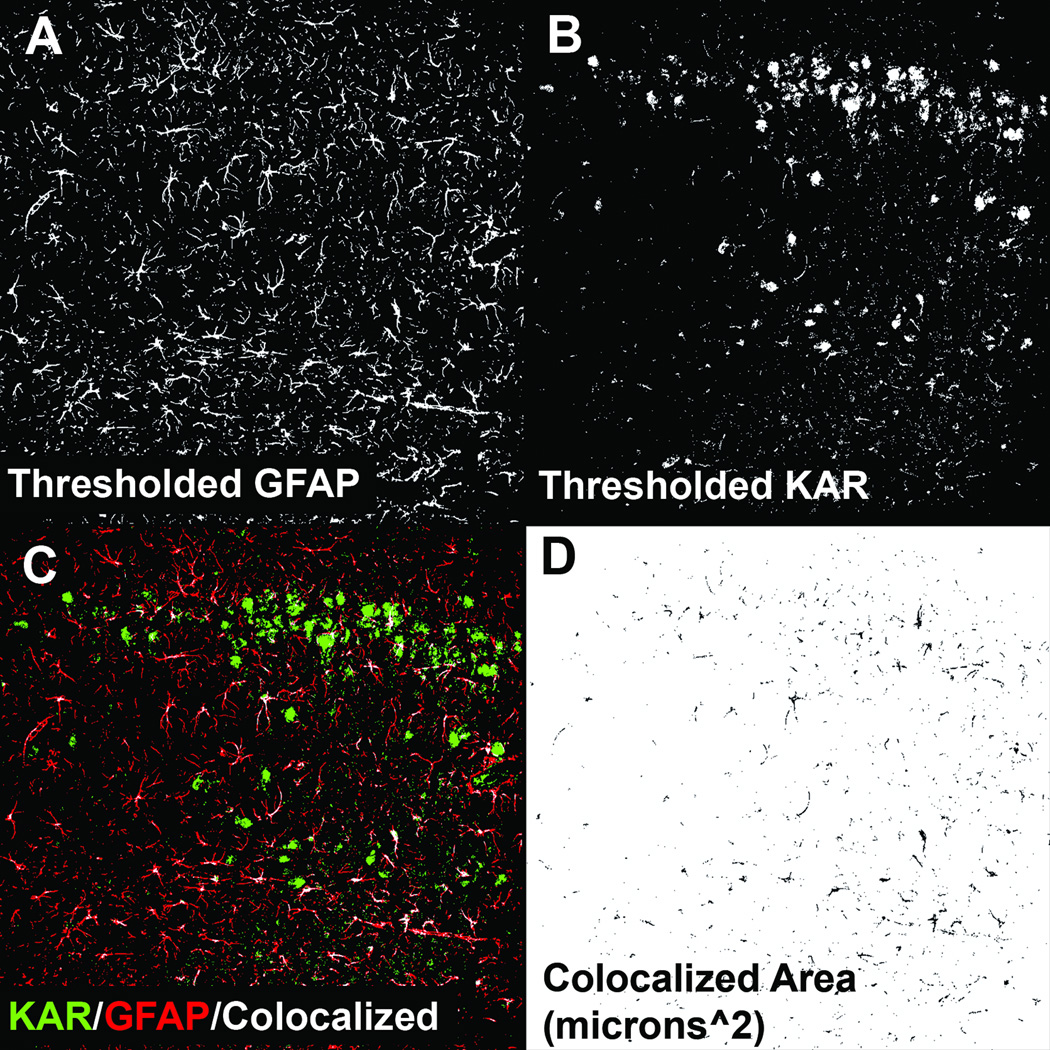
Figure 5.
Example of colocalization analysis and automated quantification. (A) Grey scale 8-bit optical section (1-µm thick) of glial fibrillary acidic protein (GFAP) staining in the CA1 region from an animal 1 week following kainic acid (KA)-induced status epilepticus (SE) that has been autothresholded using the triangle algorithm. (B) Optical section of the corresponding KA receptor (KAR) subunit stain channel that has also been thresholded. (C) Output of the colocalization plugin. (D) The plugin also generates an 8-bit image of the areas of colocalization.

