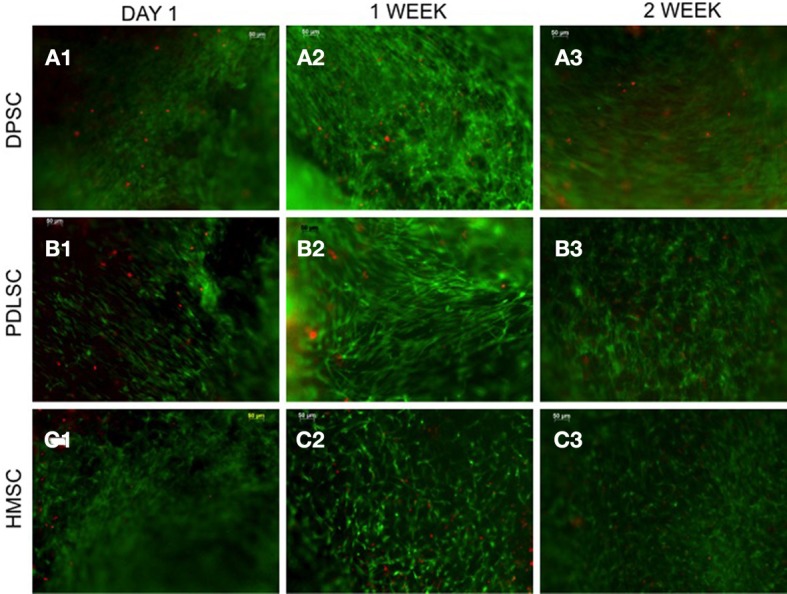
Figure 1.

Live-dead cell assay. The fluorescent micrographs are representative images of DPSCs (A), PDLSCs (B), and HMSCs (C) within the pulp ECM scaffolds imaged after 24 h (A1–C1), 1 week (A2–C2), and 2 weeks (A3–C3) post seeding. The green fluorescent cells represent live cells and the red fluorescent cells represent dead cells. All the images were imaged under the same magnification and the scale bar in all the images represents 50 μm.
