
Figure 2.
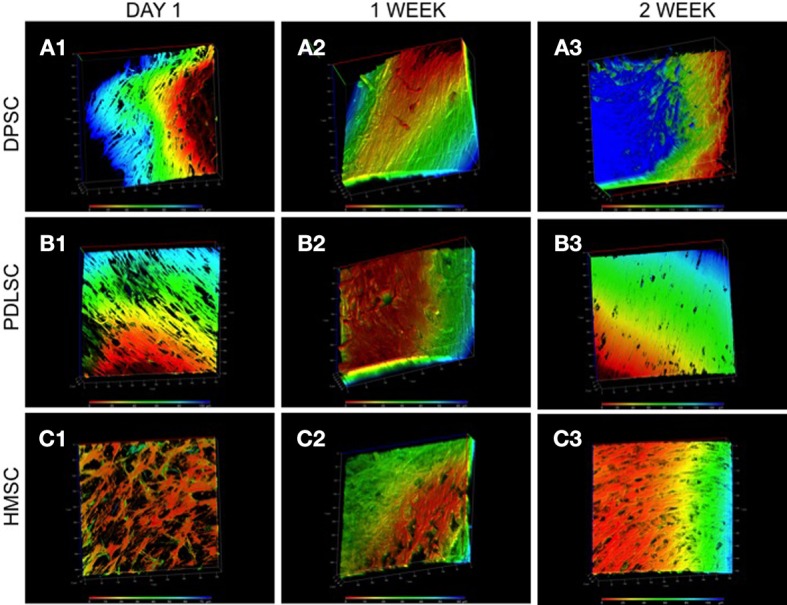
3D confocal microscopy of DPSCs, PDLSCs, and HMSCs in the pulp ECM scaffolds. The fluorescent images are reconstructed 3D images of a z-stack of confocal images that represent the arrangement of DPSCs (A), PDLSCs (B), and HMSCs (C) after 24 h (A1–C1), 1 week (A2–C2), and 2 weeks (A3–C3) post seeding. The images are color coded for depth indicating the 3 dimensional orientations of the cells. The scale at the bottom represents the scale for color-coding based on depth (μ m). The boxes surrounding the image represent the x, y, and the z-axes and are scaled in μ m.