
Figure 6.
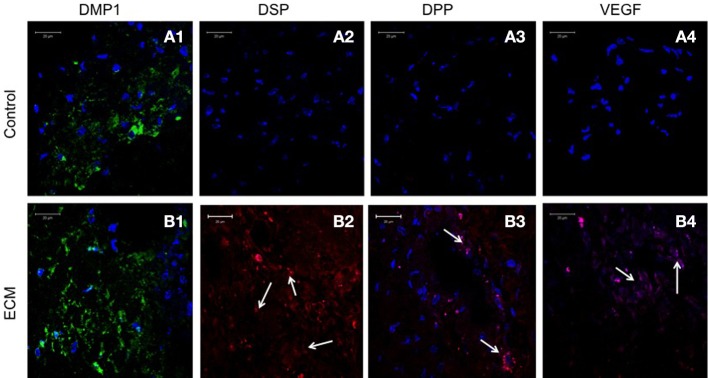
PDLSC immunohistochemistry. The fluorescent images are representative confocal micrographs of sections from PDLSC seeded scaffold explants consisting of control collagen/chitosan scaffold (A) and pulp ECM scaffold (B). The sections were analyzed for the expression of DMP1 (A1,B1), DSP (A2,B2), DPP (A3,B3), and VEGF (A4,B4). Note the absence of DSP, DPP, and VEGF signal in (A) (control scaffolds containing PDLSCs). Arrows in (B) point to positive staining of the same by PDLSCs seeded within the pulp ECM scaffold. The imaging conditions were maintained constant. The scale bar represents 20 μm in all images.