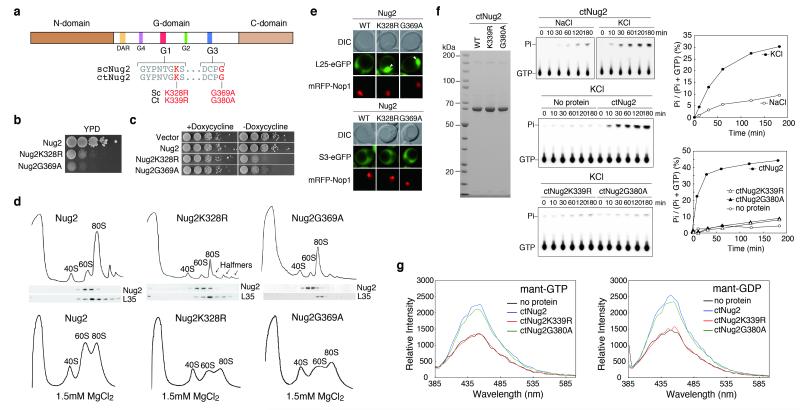
Figure 2. K+-dependent GTPase activity of Nug2.
(a) Domain organization of Nug2. (b). Complementation of nug2Δ cells by NUG2, nug2K328R and nug2G369A on YPD plates. (c) Repression (+doxycycline) and overexpression (−doxycycline) of NUG2, nug2K328R and nug2G369A in NUG2 cells. (d) Polysomal (10mM MgCl2; upper panel) and ribosomal profiles (1.5mM MgCl2; lower panel) of NUG2, nug2K328R and nug2G369A cells analyzed by sucrose gradient centrifugation. Western analysis of gradient fractions using antibodies against Nug2 and RpL35 (upper panel) (e) Subcellular distribution of RpL25-GFP and RpS3-GFP in NUG2 and nug2 mutant cells analyzed by fluorescence microscopy. (f) GTPase activity of purified ctNug2 (SDS-PAGE; left panel) analyzed by thin-layer chromatography/autoradiography (middle panel). Ratio of hydrolyzed phosphate/total GTP plotted against time (right panel). (g) Binding of MANT-GTP (left panel) and MANT-GDP (right panel) to purified wild-type and mutant ctNug2. GTPase and binding assays were performed twice yielding highly reproducible datasets.

