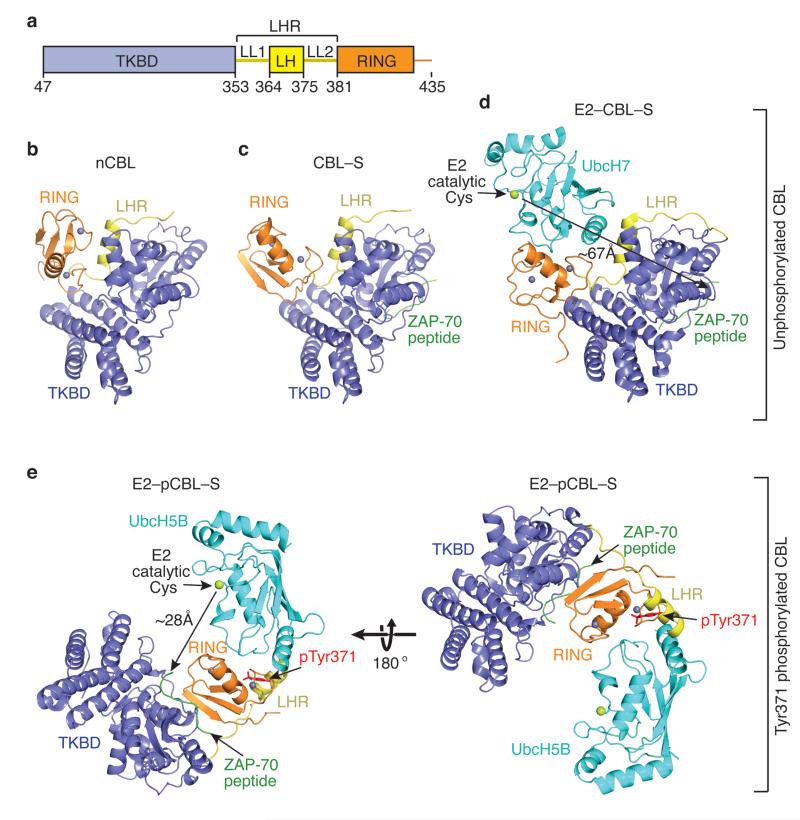
Figure 1.
Ensemble of CBL structures. (a) Diagram of the crystallized CBL fragment: TKBD in blue, LHR (LL1, LH and LL2) in yellow and RING domain in orange. Residues encompassing each domain are indicated. All structures are colored as in a and oriented as in b. Zn2+ atoms are depicted as grey spheres, ZAP-70 peptide is green and E2 is cyan with its catalytic cysteine shown as a lime sphere. Phosphorylation state is indicated on the right. (b) nCBL structure. (c) CBL–S structure. (d) E2–CBL–S structure (PDB 1FBV16). The measured gap between the E2’s catalytic cysteine and TKBD substrate peptide is shown by the arrows here and in e. (e) E2–pCBL–S structure. Right panel is in the same orientation as b and left panel is rotated by 180° about the x-axis. pTyr371 side chain is shown in red.

