Figure 2.
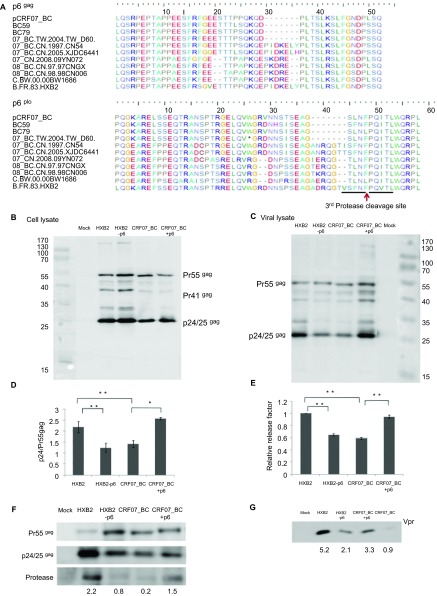
Gag and Gag-Pol polyprotein processing of CRF07_BC viruses. (A) Alignment of p6gag and p6pol amino acid sequences. The p6gag and p6pol amino acid sequences of pCRF07_BC were aligned with the prototype subtype B′ RL, CRF07_BC and CRF08_BC from China and subtype C from India. These sequences are aligned using MEGA5.0 and output data by BioEdit 7.1.9.24 Dashes indicate deletion of amino acids in comparison with the reference prototype B′ RL. The third protease cleavage site at the N-terminus of Pol was indicated. (B) Expression of Pr55gag; p41gag and p24/p25gag viral proteins in cell lysates of 293T transfectants. 293T cells were transfected with pCRF07_BC, pCRF07_BC+p6, HXB2 or HXB2-p6 plasmids. Forty-eight hours after transfection, the cell pellets were dissolved in lysis buffer and electrophoresed on a 10% SDS-PAGE. Gag proteins were detected by anti-p24gag antibody. For B and C, at least three independent experiments were conducted and the representative results were shown. (C) Expression of Pr55gag and p24/p25gag viral proteins in the viral lysates. The cell-free supernatants from 293T transfectants were centrifuged at 20 000 rpm. for 2 h through a 20% (w/v) sucrose cushion. The virus pellets were dissolved in lysis buffer and electrophoresed on a 10% SDS-PAGE. Gag protein was detected by anti-p24gag antibody. (D) Ratios of cellular p24gag/Pr55gag. The amounts of p24gag and Pr55gag in the Western blot were quantified using ImageJ software (http://rsb.info.nih.gov/ij/). The ratios represent the mean of three independent experiments with its respective standard deviation indicated. (E) Relative release factor. Relative release factor was calculated as the ratio of p24gag in the viral lysates/(Pr55gag+p24gag) in the cellular lysates. The data shown here represent the mean of three independent experiments with its respective standard deviation indicated. Incorporation of (F) protease and (G) Vpr in virus particle. The same amounts of viral lysates, as determined by the Bradford assay, were used in the F and G. The amount of protease and Vpr in the viral lysates was detected by anti-protease and anti-Vpr antibody, respectively. The signal strength of protease was quantified by ImageJ (http://rsb.info.nih.gov/ij/) and the values below the gel image represent the mean of three independent experiments. *P≤0.05; **P≤0.01.

