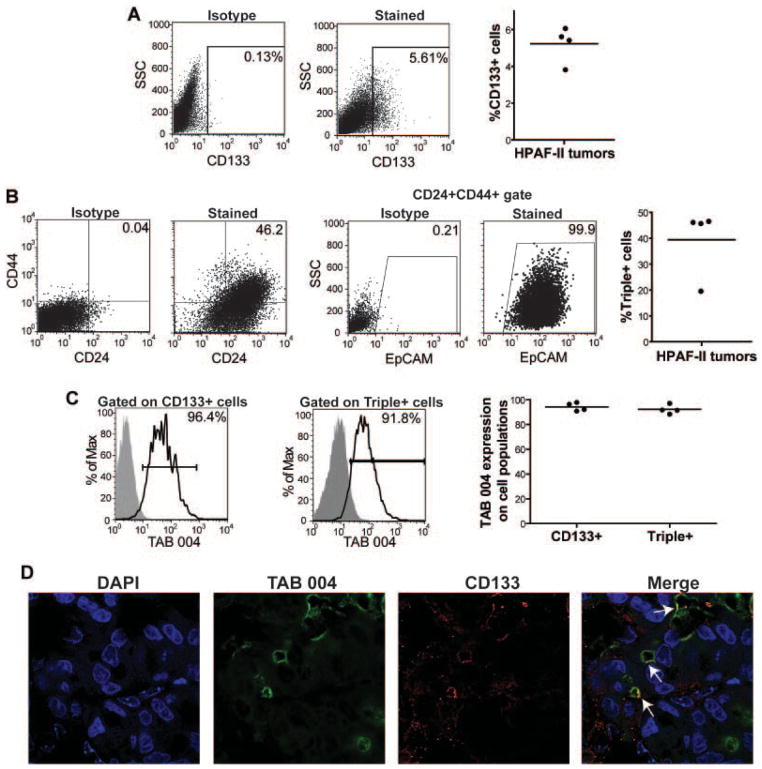
Fig. 3.
Expression of MUC1 on PC CSCs in vivo. Male nude mice were injected with HPAF-II cells into the right flank. After 25 days, mice were sacrificed and tumor sections were digested to a single cell suspension. Lineage− cells were assessed for CSC and MUC1 levels via flow cytometry. A: A representative image of CD133 stain from the HPAF-II tumors is displayed with the isotype control. B: To assess Triple+ CSCs, CD24+CD44+ cells were first gated and then EpCAM expression on those cells was determined. Representative staining and isotype controls are displayed. C: Gated CD133+ and Triple+ CSCs were assessed for their MUC1 expression via TAB 004 staining. A representative sample is shown for each. D: A HPAF-II tumor section was assessed for TAB 004 and CD133 expression using immunoflourescence. TAB 004 staining was seen throughout the tumor and localized areas of CD133 were observed. Co-localization of TAB 004 and CD133 was observed (white arrows). For all experiments (n = 4 mice) and the experiment was repeated twice.

