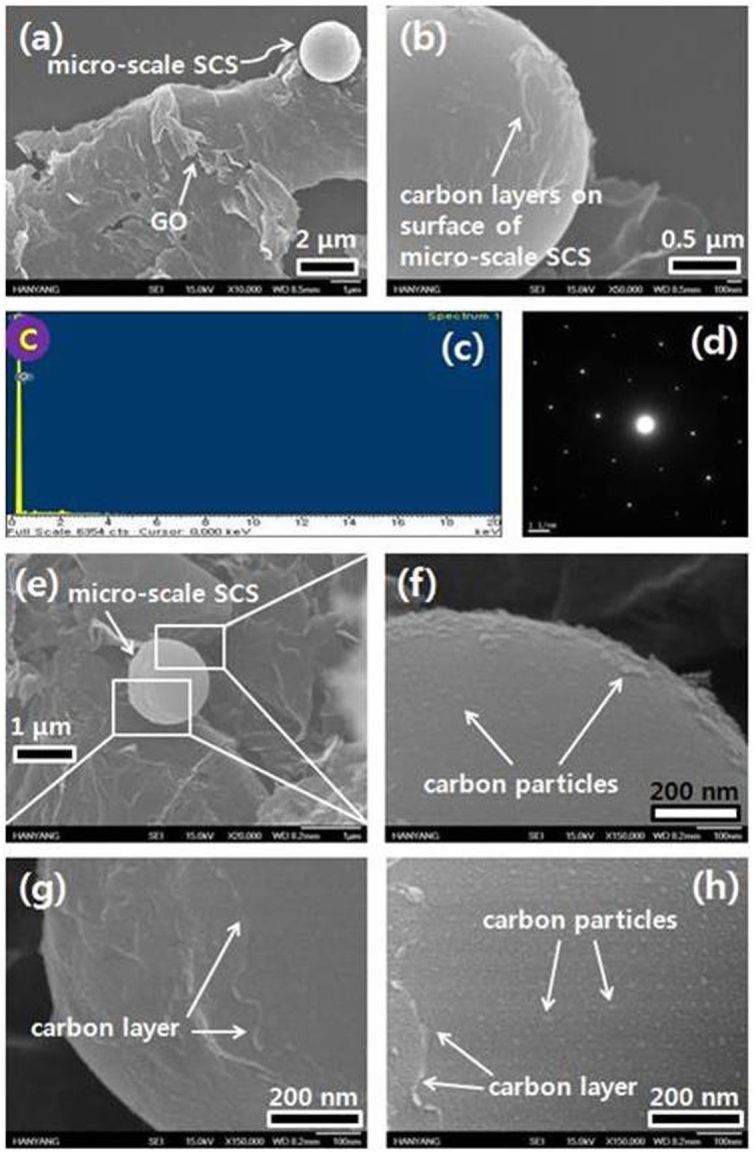
Figure 2. Observation of surface of micro-scale SCSs.

(a) FE-SEM image of a micro-scale SCS. (b) Enlarged image of the surface of the micro-meter-sized carbon sphere in (a). (c) EDX and (d) SAED spectrum of the micro-scale SCS. (e) FE-SEM image of a micro-scale SCS. (f–h) Enlarged images of the micro-scale SCS in (e).
