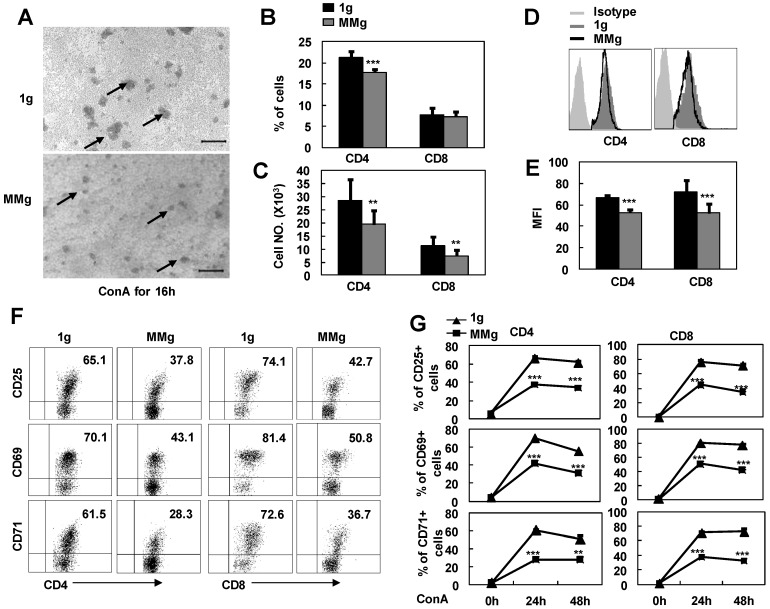
Figure 1.
The response of T cell subsets to ConA after MMg pre-exposure. The mouse splenocytes were cultured in a rotary bioreactor system for 16h in which the modeled microgravity effects were generated (a static culture system were used as control), and then, the cells were transferred to the static conditions with 2.5 μg/ml ConA supplying. A) Microscopic appearance of splenocyte colonies after a 16h-ConA simulation. The arrows show the cell colonies. Bars=100μm. The Percentages (B), and numbers (C) of CD4+ and CD8+ T cells were analized by FCM after a 24h-ConA simulation. The FACS profile analysis (D) for CD4 and CD8 staining after a 24h-ConA simulation, and the corresponding statistical results of mean fluorescence intensity (MFI) (E) were shown. F) Phenotypically characterization of CD25, CD69 and CD71 in gated on CD4+ and CD8+ T cells was evaluated after 24h activation. G) The frequencies of CD4+ and CD8+ T cell subsets positive for activation markers (CD25, CD69 and CD71) after 24h and 48h ConA simulation were summarized. Data represented as means±SD. ** p<0.01, and *** p<0.001compared with the static control group (1g).

