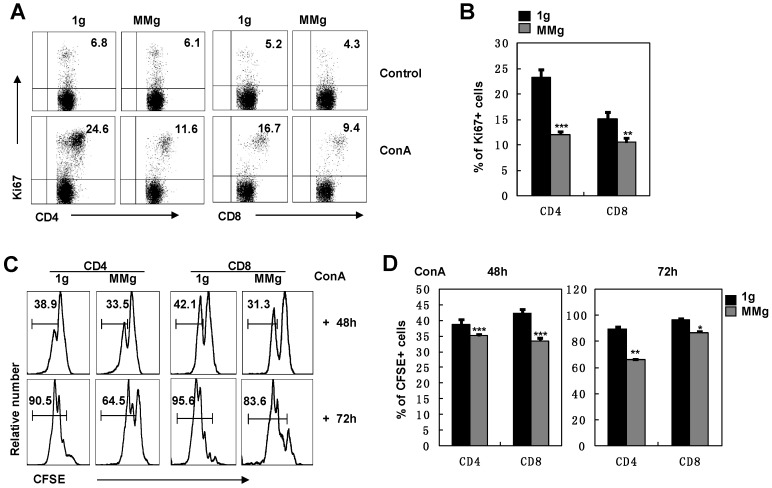
Figure 2.
The proliferation of T cell subsets in response to ConA after 16h-MMg pre-exposure. After 16h-MMg pre-exposure, the splenocytes were activated with ConA at a static conditions and the proliferation of T cell subsets was assayed. A) The FACS profile analysis of Ki67+ cells gated on CD4+ and CD8+ T cells after ConA stimulation for 48h was shown. B) The proportion of CD4+ and CD8+ T cells positive for Ki67 after ConA stimulation for 48h were summarized. The original flow cytometry histograms (C) and statistical summary representative of the proliferation percentages (D) of CD4+ and CD8+ T cells were shown. B6 splenocytes were labeled with CFSE and then cultured with ConA for 48 and 72h respectively, the cell division was determined by FCM. Data represented as means±SD. *, p<0.05, **, p<0.01 and ***, p<0.001compared with the static control group (1g).

