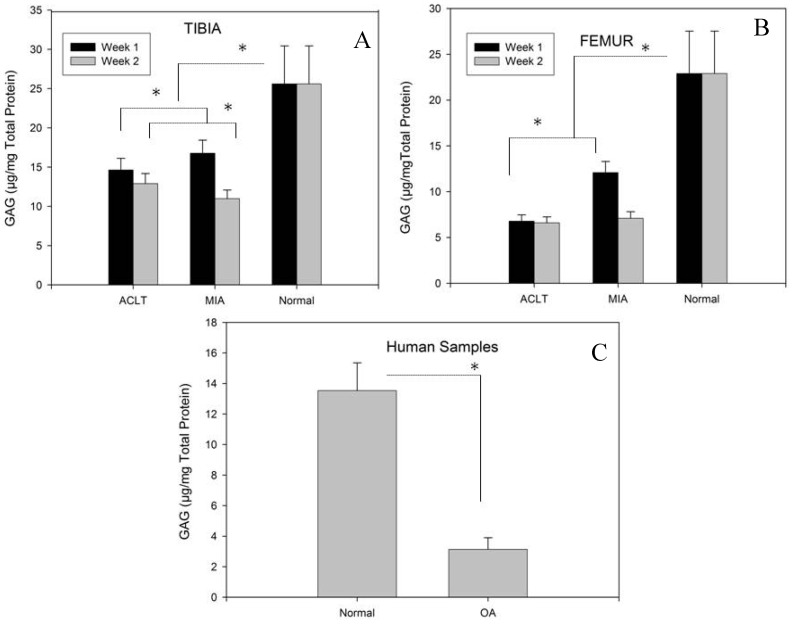
Figure 3.
Compared to the normal tissues, GAG/total protein levels were lower in both intervention groups at the tibia (A) and femur (B). Although at week 1, the GAG/total protein levels were higher in the MIA group compared to ACLT at both tibia and femur, by week 2, the concentrations had dropped to a level comparable to that in the ACLT group, specifically in femur. In human samples, significant reduction of GAG/total protein was observed in the OA samples compared to normal tissue (C) (* indicates significance p<0.05).

