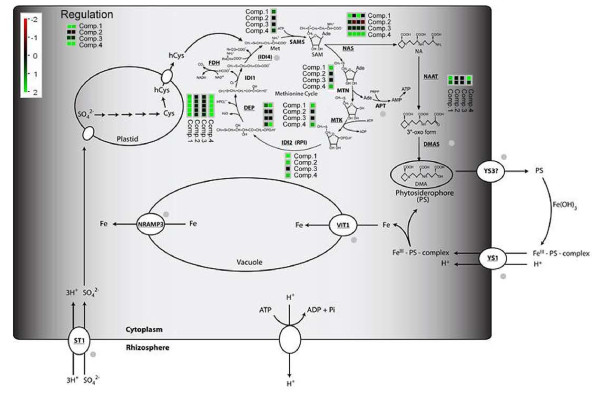
Figure 5.

Pathway analysis of iron deficiency associated chlorosis. Median log2FC across all statistical approaches are depicted by transcripts bins adjacent to corresponding genes, using MapMan and custom pathway [5] as well as mapping files (Additional file 1 and Additional file 2). Regulation of genes within relative Comparisons (1–4) are color-coded (red = lower expression in condition 1 vs. 2; green = higher expression in condition 1 vs. 2). Multiple bins next to respective transcripts indicate multiple isoforms. Abbreviations: Fe = Iron; PS = Phytosiderophores; YS1 = yellow stripe 1; YS3 = yellow stripe 3; ST1 = Sulfate transporter 1; SO42- = sulfate; Cys = cysteine; hCys = homo-cysteine; FDH = formate dehydrogenase; DEP = methylthioribulose-1-phosphate dehydratase-enolase-phosphatase; IDI1 = 2-keto-methylthiobutyric-acid forming enzyme; IDI4 = putative aminotransferase catalyzing the synthesis of methionine from 2-keto-methylthiobutyric acid; SAMS = S-adenosyl-methionine synthase; MTN = methylthioadenosine / S-adenosyl homocysteine nucleosidase; MTK = methylthioribose kinase; IDI2 = eukaryotic initiation factor 2B-like methylthioribose-1-phosphate isomerase; NAS = nicotinamine synthase; NAAT = nicotianamine amino-transferase; DMAS = 2’-deoxymugineicacid synthase; APT = Adenosin phosphoribosyltransferase; VIT1 = vacuolar iron transporter 1; NRAMP3 = natural resistance associated macrophage protein 3; Regulation = GRMZM2G057413 (homology to OsIRO2 and GRMZM2G350312 homology to OsIRO3 and AtPYE).
