Figure 4.
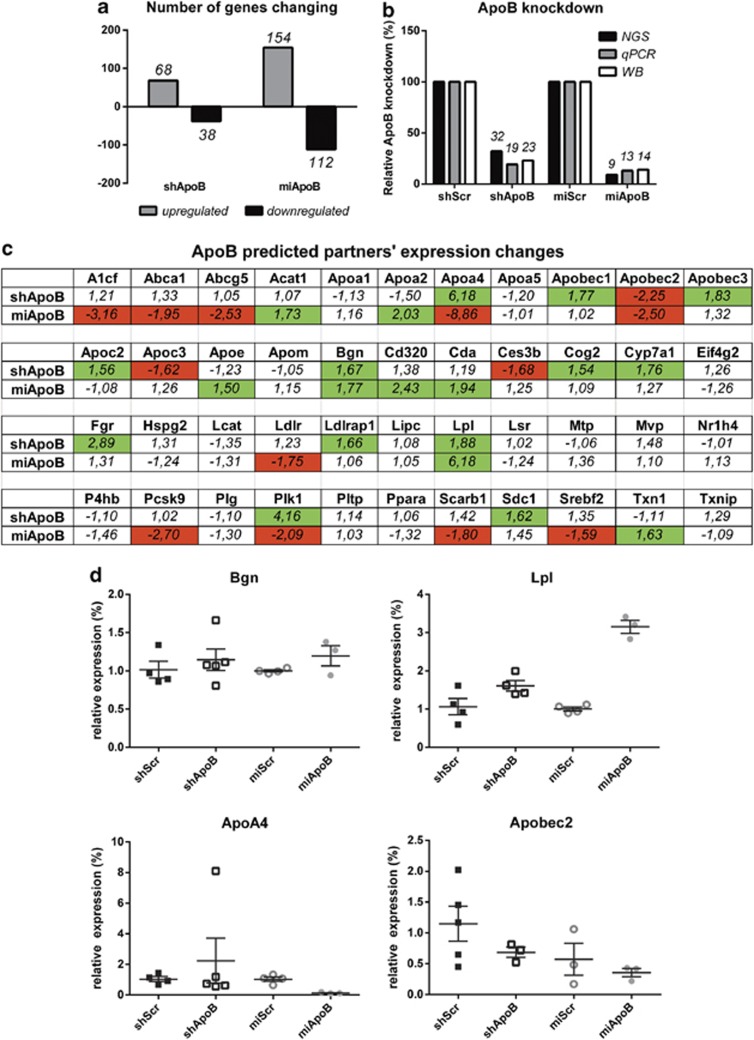
NGS transcriptome analysis on gene expression profiles between AAV-shApoB- and AAV-miApoB-injected animals. To analyze liver transcriptome, total RNA was isolated from a representative animal 8 weeks p.i. and NGS analysis was performed. The expression abundance for all genes was quantified using the RPKM measure. Expression data were compared using Kal's Z-test with Bonferroni correction. Genes that showed a significantly altered expression (P<0.05) were used in further analysis. (a) Genes significantly upregulated or downregulated in AAV-shApoB- and AAV-miApoB-injected animals. Gray and black bars represent number of genes upregulated and downregulated, respectively, compared with AAV-shScr or AAV-miScr controls (P<0.05). (b) Comparison of ApoB knockdown in vivo by NGS, qRT-PCR and protein western blot. In all assays, ApoB expression levels were calculated relative to AAV-shScr or AAV-miScr, which served as negative controls and were set at 100%. (c) Prediction of ApoB functional interactions was performed with STRING software.49 Upregulated genes (fold change >1.5) were marked in green and downregulated (fold change <−1.5) were marked in red. (d) qRT-PCR analysis of Bgn, Lpl, ApoA2 and Apobec2 expression in murine liver 8 weeks p.i. Total RNA was isolated from snap-frozen liver tissues and qRT-PCR was performed with Bgn-, Lpl-, ApoA2-, Apobec2- and actin-specific primers. mRNA levels were calculated relative to actin mRNA. Expression levels in the shScr and miScr were set as 100% for shApoB and miApoB groups, respectively. Data are represented as individual measurements with mean values±s.e. plotted.

