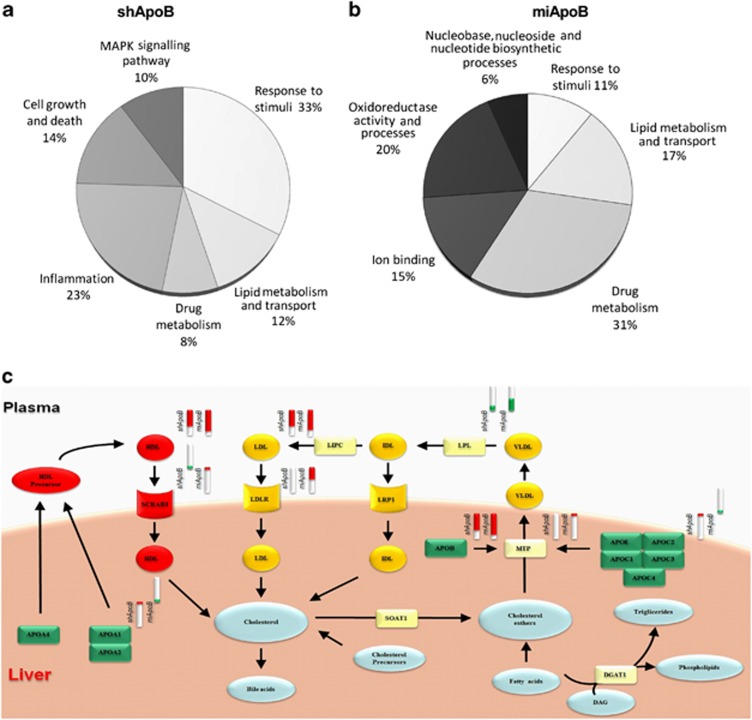
Figure 5.
Functional categorization of gene expression changes in AAV-shApoB- and AAV-miApoB-injected animals. (a, b) Percentage and functional categorization of genes that are significantly changed in expression in AAV-shApoB and AAV-miApoB animal groups. Up- and downregulated genes in AAV-shApoB and AAV-miApoB groups (P<0.05) were annotated to Gene Ontology (GOTERM_BP_FAT and GOTERM_MF_FAT) and KEGG (KEGG_PATHWAY) using the DAVID v6.7 (National Institute of Allergy and Infectious Diseases (NIAID), NIH). Significant annotations (P<0.05) were grouped in eight categories and the percentage of genes in each category was calculated with reference to all genes annotated in the DAVID analysis. (c) Outline of cholesterol pathway changes in AAV-miApoB- and AAV-shApoB-injected animals. There are several types of lipoproteins within blood: chylomicrons, very-low-density lipoprotein (VLDL), intermediate-density lipoprotein (IDL), low-density lipoprotein (LDL) and high-density lipoprotein (HDL). ApoB100 protein is synthesized in the liver and it forms the structural protein in VLDL and LDL particles. HDL is secreted by the gut and liver and receives additional components during the metabolism of triglyceride-rich lipoproteins. Therefore, inhibition of ApoB affects VLDL-C, LDL-C and HDL-C levels. Genes significantly altered in the AAV-shApoB and AAV-miApoB groups were used (P<0.05) for toxicology prediction using Metacore software (Thomson Reuters, New York, NY, USA) and the top-scored map was generated. Experimental data from AAV-shApoB and AAV-miApoB groups are linked to and visualized on the image as thermometer-like figures placed in the top right of respective gene or group of genes. Upward red-colored thermometers indicate upregulated components and downward blue thermometers indicate downregulated components of the pathway.

