Figure 1.
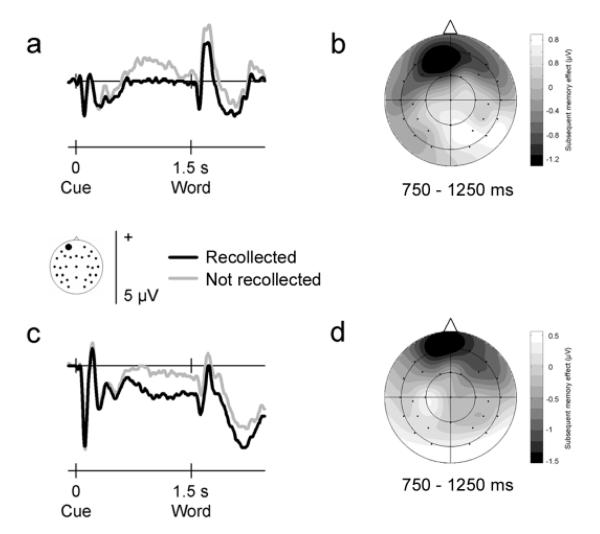
Neural activity that precedes memory formation of visual and auditory events. Group averaged ERP waveforms elicited by pre-stimulus cues at a representative frontal electrode site (site 50 from montage 10, www.easycap.de/easycap/e/electrodes/13_M10.htm; equivalent to site Fp1 of the 10/20 system). Positive values are plotted upwards. (a) ERPs elicited by visual cues signalling a semantic decision about an upcoming visually-presented word, overlaid according to whether the word was recollected (given a ‘remember’ judgment) or not recollected (given a ‘know’ or ‘new’ judgment) in the subsequent recognition memory test. The ERPs differ reliably before word onset according to later memory performance. (b) Two-dimensional voltage spline map showing the distribution of the subsequent memory effect (difference between recollected and not recollected words in the 750-1250 ms interval after cue onset) across the scalp for visual events. The map is range-scaled. The pre-stimulus effect exhibits a negative-going, frontally-maximum distribution. (c-d) As (a-b), but data for auditory cues signalling a semantic decision about an auditorily-presented word. Auditory events exhibit the same pre-stimulus effect as visual events.

