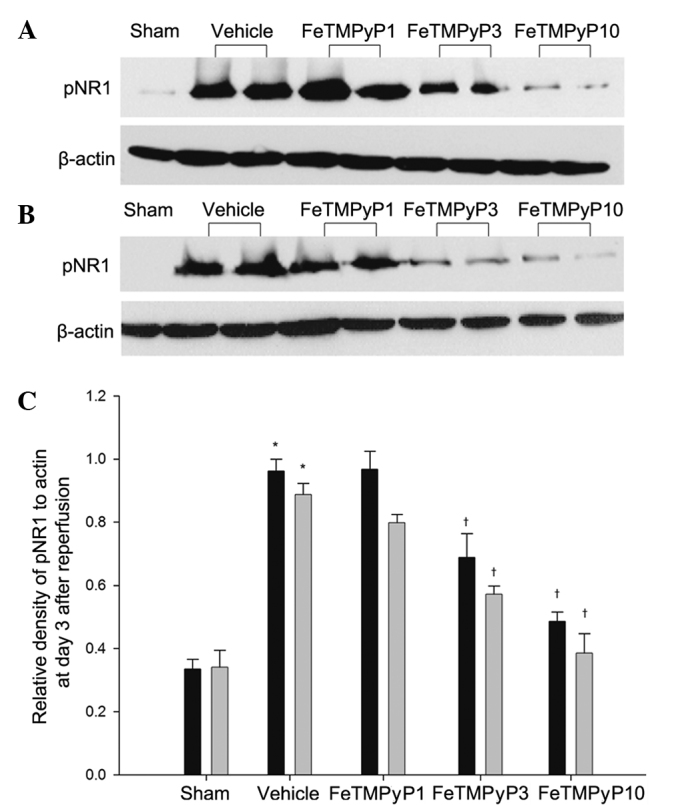
Figure 2.

Changes in the relative density of pNR1 protein in the spinal cord (L4/6). Western blotting was performed to measure pNR1 expression levels on the third day following reperfusion in the (A) ipsilateral and (B) contralateral sides of the spinal cord. (C) Quantification of the pNR1 expression levels on the ipsilateral (black bar) and contralateral (gray bar) sides of the spinal cord based on western blot analysis. The data are presented as the mean ± SD. n=4 for all treatment groups. *p<0.001 versus the sham group. †P<0.001 versus the vehicle group. FeTMPyP, 5,10,15,20-tetrakis (N-methyl-4′-pyridyl)porphyrinato iron (III); FeTMPyP1, 1 mg/kg; FeTMPyP3, 3 mg/kg; FeTMPyP10, 10 mg/kg; pNR1, phosphorylated NMDAR subunit 1.
