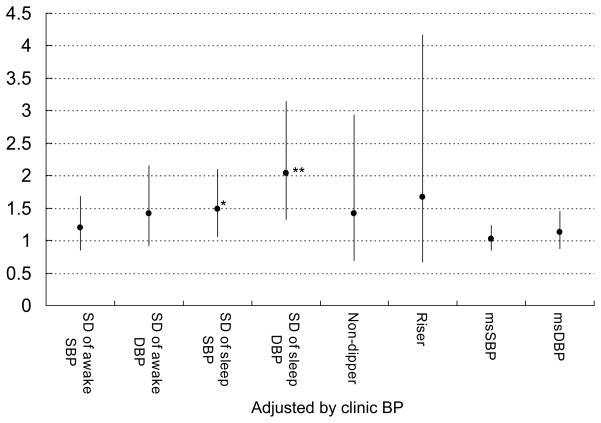
Figure 2.
The predictive utility of each BP measures (non-dipper/riser pattern, yes or no, morning BP surge, and awake/sleep BP variability measures). Plots (bars) are shown as multivariable hazard ratio (95%CI) by 10-mmHg increase of each SBP/DBP and 5-mmHg increase of each SD of SBP/DBP values controlling for age, current smoking, and clinic SBP/DBP (each) as significant potential covariates. MS indicates morning surge. *P<0.05, **P<0.01.

