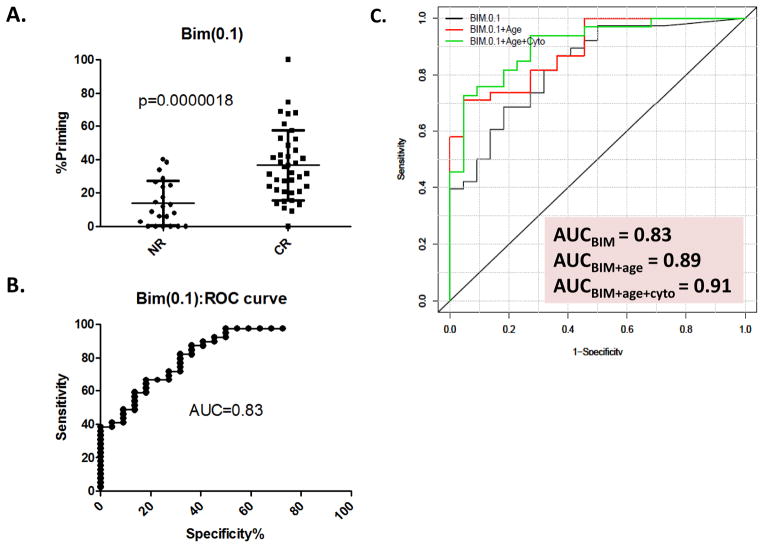
Figure 1. Dot-plot and ROC-plot depictions of BIM patient response discrimination.
A. Dot-plot for the mean %priming (± S.D.) of BIM(0.1) comparing the 22 non-response (NR) and 39 clinical response (CR) patients. Higher BIM(0.1)%primed patients have statistically better clinical response. Statistical significance was determined using the Mann-Whitney Analysis B. ROC-plot of the sensitivity and specificity of BIM(0.1) as a predictor of clinical outcome as determined by the ROC curve (AUC=0.83) using the 61 patients for which there was available data for this marker. C. Multivariate analysis ROC curve for BIM(0.1) alone (Black), or BIM(0.1) combined with significant adjustment clinicopathological variables (+patient age [Red] or +patient age+cytogenetic status [Green]).

