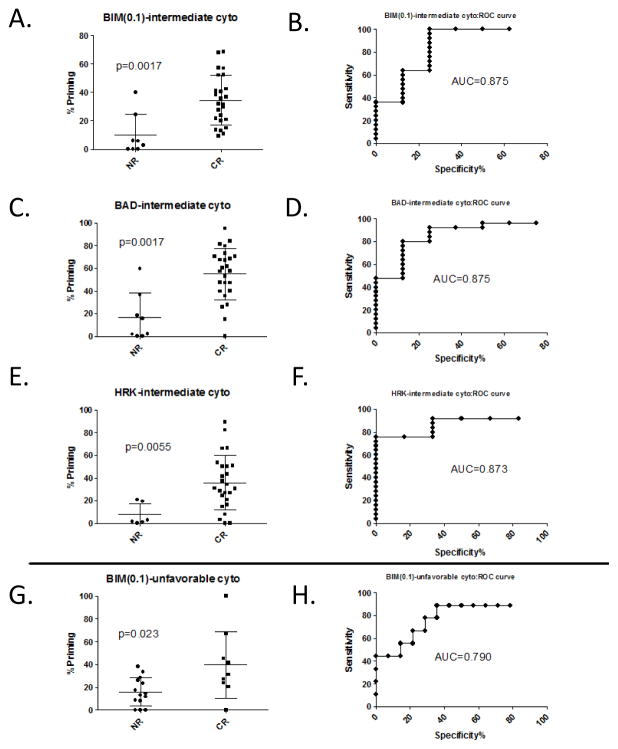
Figure 2. BH3 peptides response prediction stratified by cytogenetic status.
Response prediction stratified by intermediate cytogenetic status (A–F) depicted in dot-plots (A, C, and E) and ROC-plots (B, D, and F) for BIM(0.1) (A and B), BAD (C and D), or HRK (E and F) or unfavorable cytogenetic status for BIM(0.1) as a dot-plot (G) and ROC-plot(H). BIM(0.1), BAD, and HRK were all statistically significant for intermediate cytogenetic status (p value <0.01 and AUC >0.85). Statistical significance was by Mann-Whitney Analysis. (Mean ± S.D. for each set is indicated on dot-plots).

