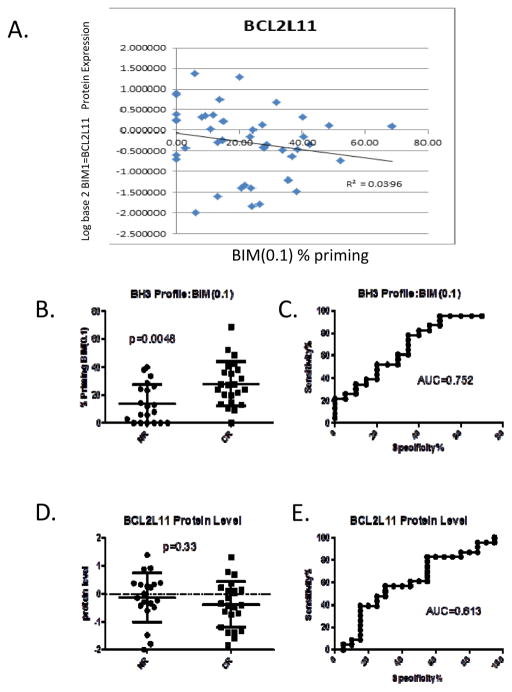
Figure 3. Correlation of BIM (0.1) Priming and BIM (BCL2L11) Protein Levels and Response Prediction.
BIM protein levels (BCL2L11) determined by RPPA assay were compared to BIM(0.1) BH3 profiling % priming yielding an R2=0.0396 indicating that the two metrics are distinct from one another (A). When statistical analysis is restricted to only patients for which there is BH3 profiling and corresponding BIM RPPA data, BIM(0.1) BH3 profiling remains significant predictor of response (B and C) while BIM protein levels are not (D and E). (Mean ± S.D. for each set is indicated on dot-plots).

